So I sat down last week with the intention of working on a new spaceship model but I just wasn’t feeling it. On the other hand, I’ve been doing a fair amount of coding at work and was in the programming mindset. I’ve been thinking about getting back to working on my Second Sathar War (SSW) game but wasn’t quite up to tackling that yet. So I decided to dust off the Star Map Generator that I’d been working on (and used to create the Extended Frontier Map) and add a graphical user interface (GUI) to it in order to make it a little more user friendly for non-programmers.
Since the code is written in Python, and I’m already familiar with the wxWidgets GUI framework from my work on the SSW game, it made sense for me to use the wxPython framework, which is just wxWidgets for Python. Since I’m seriously considering converting the SSW program over to Python, this would give me a bit of practice.
Also, this post is going to be my entry for the RPG Blog Carnival this month. The exact topic is “To Boldly Go” hosted by Codex Anathema and is on the topic of exploring the planes and other worlds. It’s couched in terms of Spelljamers and from a fantasy perspective (common with the blog carnival) but I thought, if you’re going to be exploring new worlds, you need a map. So I’m tossing this tool out there for people to use in making their maps.
Building the Basic GUI
The first step was to just implement a basic interface over top of the existing code. The main goal here was to allow the user to specify the various map parameters that up until now, I’ve had to write into the code whenever I wanted to run the program. I’ve never implemented a way to pass those parameters in when it starts. That ability is actually issues number 3 (Add command line parameters) and number 4 (add configuration file option) on my list of open issues. This interface doesn’t solve those issues, but it does provide a workaround.
Building an interface that just accepts some input and stores the values is pretty straightforward and in just a short time (after getting my development environment all set up), I had the basic interface.
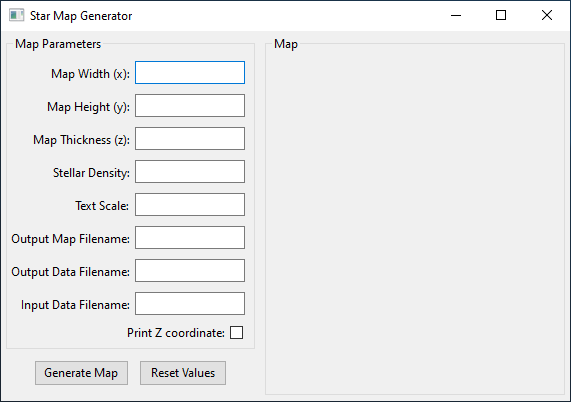
It didn’t do anything yet, but could accept the input of all the parameters you need to set to generate a map. Let’s talk briefly about each of those parameters.
- Map width – This is just the horizontal size of the map. If you’ve seen any of the maps I’ve made with the program, it’s just the number of boxes wide the map will be. The units are light years (this will be important shortly).
- Map height – The vertical height of the map, again in light years
- Map thickness – This is the z dimension of the map or how thick of a slice of space you are looking at, again in light years. This is the total dimension just like the width and height. The program will split that into a maximum positive and negative value for use in system generation.
- Stellar density – This is a measure of the number of stars that should be placed on the map. The units are star systems per cubic light year, which is why the number is so small. The default value (0.004) is roughly the stellar density around the Sun. If you want your map to a parsec (3.26 ly) per square instead of light years, and keep the same approximate density, you’d use a value of 0.138 (a factor of almost 35). That will be a very crowded map.
- Text scale – As I’m writing this I realized this is mislabeled. While the setting here does affect the text size that is printed on the map, it also affects the size of the stellar symbols printed as well. The default is 1 and that is what I used on the Yazira Sector map. However, I used a scale of 1.5 on the Extended Frontier Map.
- Output map filename – This is the name of the output map image file. It will be an SVG file and should have .svg as its extension.
- Output data filename – This is the output file that contains all the coordinates, names, and spectral types of the stars generated as well as the list of jump routes generated. It’s just a text file and you can call it anything you want. I typically use the same same as the map file but with a .dat extension so I can keep track of them together.
- Input data filename – This field is left blank for a randomly generated map. If you specify a name here, the program will try to load that file and use it to generate the map. The file should be the same format as the output data file. This allows you to randomly generate a map, then tweak the data file and have the program redraw the map with your modifications. This is how I made both the Yazira Sector map and the Extended Frontier Map. If the file specified doesn’t exist, the program will probably crash. Or at least not do anything.
- Print Z coordinate – This just tells the program whether is should print the z-coordinate (distance above or below the plane of the map) on the map itself. You can see what that looks like on the Yazira Sector Map. I had it turned off for the Extended Frontier Map.
I initially implemented those boxes as simple text boxes but realized that the first five really needed to read in values so I changed them in the code. I should probably change the Input data filename field to be an Open File dialog so that it guarantees that the file is actually there. I’ll need to add that to the open issues.
Finally I added the code to properly process the buttons. Clicking “Generate Map” will do exactly that and write the files to disk in the same directory where the program is located. Clicking “Reset Values” will change all the input values back to the defaults if you’ve made changes.
Making the Program Distributable
By adding the GUI to the program, you need even more setup to run it. Before, you just needed a Python installation as it was pretty vanilla code, but you still needed to install Python. Now, in addition to Python, you need to have installed the wxPython distribution as well. Since I wanted to make this easily usable by non-programmers, I wanted it to just look like another program you that click on and run. So I started looking for ways to package it up for distribution.
It turns out there is a great little Python program called pyInstaller. It takes your program and bundles it up with all the code and files it needs to run and puts it into either a single program file (.exe file) or a folder with all the bits you need and an .exe file to launch it. You can then just distribute it as a zip file, users can unpack the zip file, and run your program.
I tried it out and sure enough, it just worked. You could click on the .exe file and the program would run. Here’s that version of the program. Just download the zip file, extract it somewhere, and run the StarMapGen.exe file.
StarMapGen-initialGUI.zip (12.3MB)
It works fine, but everything is done behind the scenes and the files are created on disk in the directory where you launched the program.
Adding in the Map
The next step was to add in a map display. I mean, what good is having a graphical interface if you don’t get to see the map?
This is where I ran into the first snag. It turns out that the current release version of wxPython (4.0.7) doesn’t have the ability to read in an SVG file and display it. It can write one if you’ve created your image from it’s primitives, but in my case, I’m writing the SVG directly and just want a display. Luckily, the current development version of the package (4.1.0a) does have that capability.
Normally I try to stick with the released versions of packages, but after looking around, all the other options for displaying SVG files required more packages to to be added to the dependency list and in the end, used the same backend that I would have to install for wxWidgets. So I bit the bullet and upgraded to the head of the development channel. Since pyInstaller grabs everything you need and packages it up, I wasn’t too concerned.
So I wired everything up so that when you click that “Generate Map” button, in addition to creating the map and writing the files, it would then load up the file in to the panel on the right hand side of the GUI. Unfortunately, it ended up looking like this:
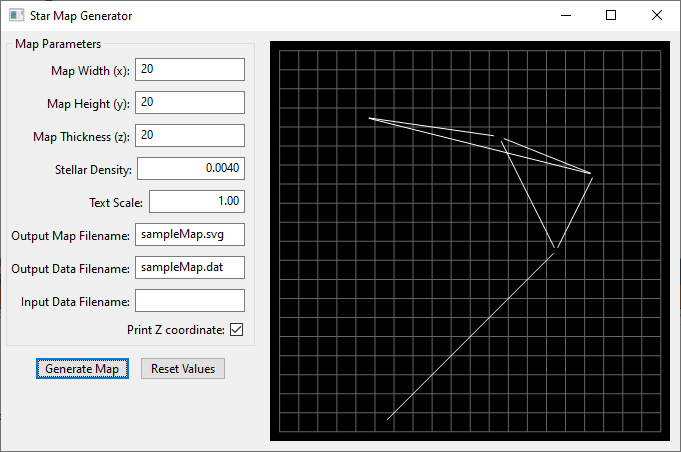
Notice anything missing? It’s supposed to look like this:
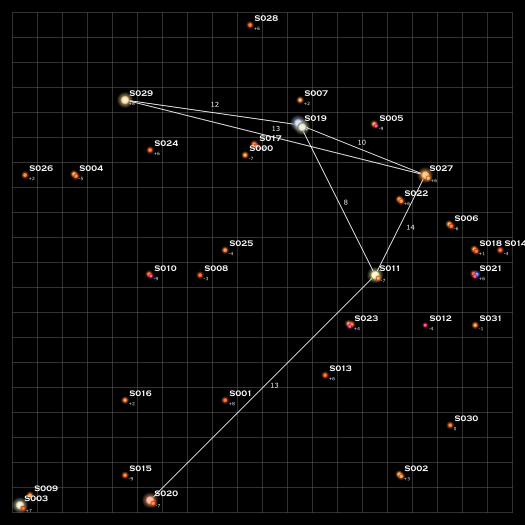
All of the stars and text were missing. Not very satisfying.
Fixing the Stars
For the stars, the SVG code uses a series of radial gradients to create the limb darkening and glow effects and maybe the default renderer just couldn’t handle those yet. After all, it was the development version of the software.
So I started digging. Since the default renderer wasn’t working, I looked for alternatives. The package gives a couple of other options for renderers, the best one being based on the Cairo package. This is the same package that I saw being recommended for rendering when I was searching around earlier. I didn’t really want to pull in another dependency but after trying everything else and failing, I added that in. Unfortunately, that didn’t work either.
However, after some testing, I was able to run the wxPython demos and found that it could render radial gradients. A lot of the sample images had them and the images were created by Inkscape, which I had based my code off of. So it had to be an issue in the code I was writing for the image.
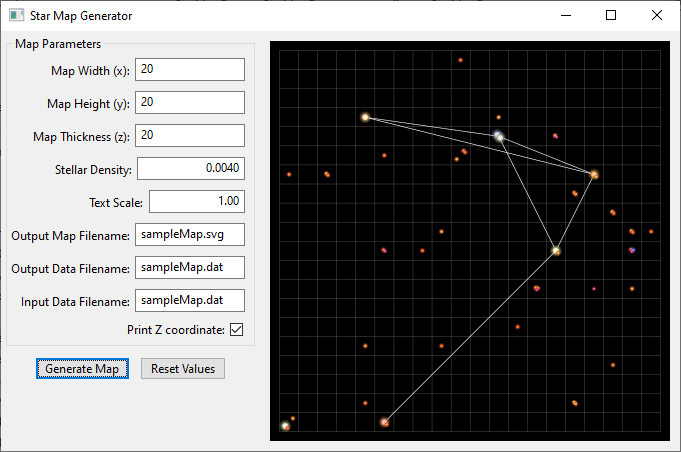
After much experimenting with simple images and trying to render them, I finally discovered that the old Inkscape code I based the SVG data on just wasn’t up to snuff. I originally wrote that code in 2015 and things had moved on. Luckily, it didn’t take much to fix it, I just had to add two additional parameters to the gradient specification to get it to work (cx="0" cy="0" if you’re wondering).
When I next ran the program, the stars appeared!
Fixing the Text
Next up was to figure out why the text wasn’t rendering.
In the SVG file I’m writing, the labels are all rendered as <text> elements. You’d think that would just work but it wasn’t. After the experience with the gradients, the first thing I checked was my implementation. I went into the new Inkscape and exported a simple SVG with just a few characters. That wouldn’t render.
Next I tried some other on-line SVG code generators to create some <text> elements. Those wouldn’t render either.
I then went looking at the sample SVG files from the demos. In every case, it seems that the text in those files were not stored as <text> elements but rather had been converted from text to paths. In other words, they were no longer text but rather drawings.
It appears that the renderers don’t handle the <text> element. This is a bit of an issue because I want to be able to edit the text as needed. Mostly I’m just moving it around, but sometimes I want to be able to change it as well. And once it’s a path instead of text, you can’t edit the characters. Plus I eventually want to allow the user to specify the fonts used on the map (That’s even an open issue, number 5). I like the defaults I’m using but users should have options.
I could have the program write the paths for the text, it would just require hard coding in the paths for the various characters. Currently there are just 23 characters used across two fonts but I don’t really want to do that as that makes it harder to use different fonts or add in additional characters.
In the end, I decided to pass on this issue for now and revisit it at a later date. The full file written out by the program has the text in it, you just don’t see it in the preview at the moment. When I revisit this, I have several options from just building a library of character paths, writing code to do the conversion from text to paths, or even writing code for wxWidgets to do the text rendering natively. There is also the option to use the native wxWidgets primitives to generate the map and then using its ability to write SVG files to make the map file. All will probably be explored.
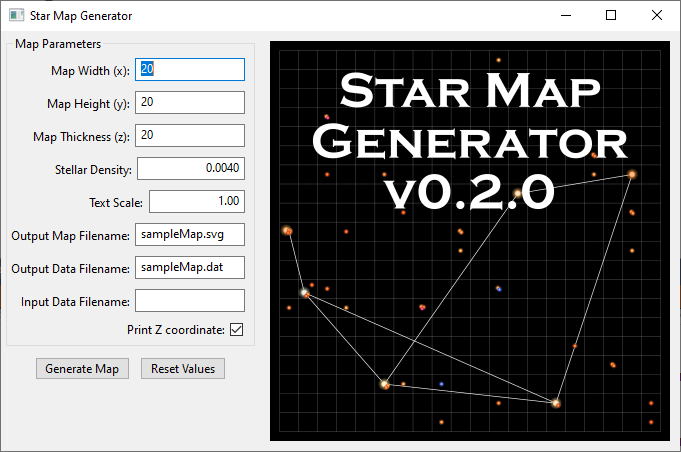
After taking a pass on generating text, I did make a banner image for the program to load that rendered the text as a path so you could see it. This now what you see when you load the program.
Adjusting the Display
The last thing I wanted to tackle in this version was resizing the display. You may have noticed that all the maps I’ve shown so far have been square. But you don’t necessarily want a square map. Otherwise, why allow specification of both a height and a width?
By default you get the display shown in the pictures above. However, I wanted the user to be able to enlarge or reshape the window and have the map expand (or shrink) to fill as much of the space available as possible. This required playing a bit with the layout engine in wxWidgets.
If you notice, in the very first image, the region on the right has a little border around it with the “Map” label. I had intended to keep that border but the layout element that makes it will only resize in one direction and I couldn’t come up with a way to make it stretch in both. It may be possible but I wasn’t finding it and it wasn’t that important. In the end I went with a different element that did stretch the way I wanted, I just lost the border. Which really isn’t that big of a deal.
Now when you generate a map it will scale the map to fit in the available space and then you can resize the window and it will expand or shrink as needed to keep the whole map visible. Here are some examples.
First just a new square map. It fits just fine since the map area was already square.
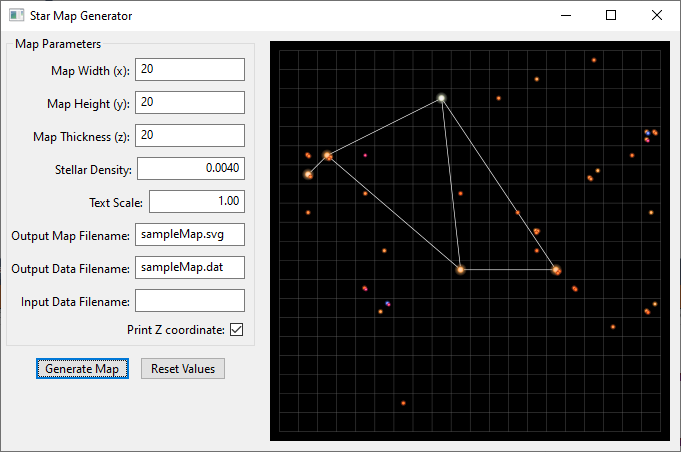
Next, let’s make the map 30 light years wide. When we hit the “Generate Map” button, we get a view like this:
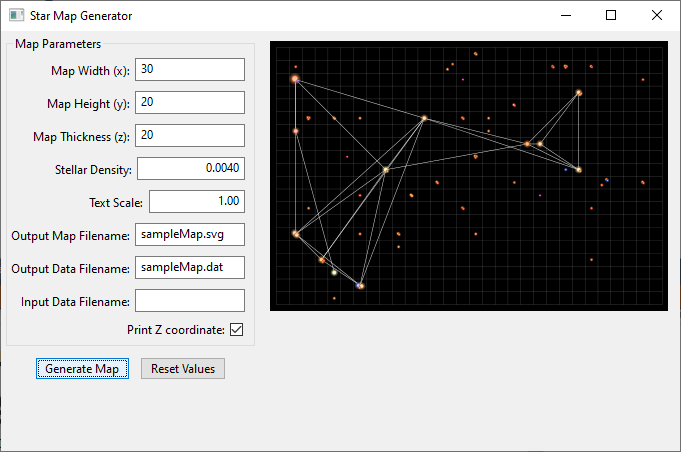
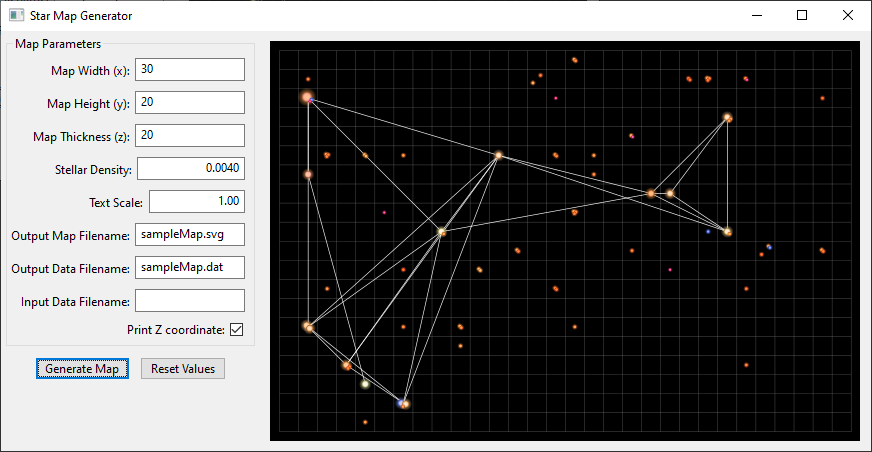
It’s all there, but has been shrunk down to fit in the space provided. But now we can grab the side of the window and stretch it out a bit to make everything fit.
Packaging Woes
At that point, I was going to package it up as a distributable program and add it to the blog post so you could grab it and play with it. Unfortunately, the addition of the extra dependencies for some reason caused pyInstaller to fail and not make a proper program that I could share. I think it’s just not finding the Cairo rendering library. It has tools to handle that, but I haven’t had time to sit down and figure it out. I finished this last night and am writing this post just an hour before it gets published. Look for an update later this week with the program once I figure it out.
UPDATE:
I got the packaging working. You can grab the version of the program that does the proper rendering of the stars from this link:
Just download it, extract the contents of the folder, and run the StarMapGen.exe file.
Getting the Code
That said, if you’re comfortable installing Python and the dependencies, you can get the code from my StarMapGen GitHub repository. This version of the program is sitting on the master branch. You’ll need to also install the cairocffi Python package and follow the instructions on this page to get the development version of wxPython. Once you’ve done that, the StarMapGen.py script is the main file for the GUI version of the program. makeMap.py is still the command line main program.
What’s Next?
There are a lot of things still left to do and work on. Already identified is the issue of the text rendering in the preview and some of the existing open issues.
A bug that I noticed with the GUI is that if you specify a data file to load, if it’s not square, it doesn’t get scaled properly in the display when rendered and loaded. That will probably be the first issue I track down.
Other improvements include adding a parameter to allow you to turn on and off generation of the jump routes and if you are making them, another parameter that specifies the maximum distance that the program will use to connect systems (currently set to 15 light years).
I also want to add some features to the GUI to include instructions, the ability to save parameter sets, and specify a random seed for map reproducibility.
Finally, I need to do some refactoring of the code to clean it up and document it better.
I’ll be working on this more in the coming weeks so expect to see updates in the future. If you’d like to help out with the code, feel free to clone the repository, make changes and submit a pull request.
What do you think of the program as it now stands? Are there features you’d like to see? Let me know your thoughts in the comments below.

Wow! I’m like super impressed! I haven’t played a sci-fi RPG in a long time, and you just sparked my cravings! I think I’ll give Alternity 2ed a try 😉
Thanks for participating in the RPG Blog Carnival!
Since you are basing on Star Frontiers, I have a few ideas.
1) Also generate information based on the SF/KH data sets for star systems and planets, in an accompanying text file or something. Maybe not locked down to the existing info, so that we could add new fields to generate from – possibly base the star/planets/civilization generation off of text files so they are easy to edit or add to?
2) Customized sector labels at the edges of the map so that we can piece together larger maps.
3) Optional data for z-axis offset from the plane of the map, and recalcing the jump routes based on the distance between the two 3d coordinates.
Thank you for the cool software!
The ability to do the 3rd on is already there in the software, and if you make a random map, you get z-coordinates as well. The Star Frontiers ones I’ve done have just had z=0 for everything but I’m working on a version with some z variation.
It does generate a text file with the stellar types. I think a planetary system generator might make better sense as a separate program but could be incorporated.
I’ll keep in mind the sector labels idea. I’ve been thinking about how to piece together different maps with my Yazira sector map.
I’m glad you enjoy the program.
I did not explain myself well regarding the text file thing. I didn’t mean to say it didn’t generate a text file, I meant to suggest that it use a text file with parameters when generating data… basically an editable preference file that anyone could add their custom data sets to, and your program would recognize the various (XML?) fields plus variables, and generate the resulting output accordingly. That way someone could use SF/KH data, or Star Trek, Star Wars, Traveller, or even custom data sets with the random star generation of your software. That way, you wouldn’t need to make a separate software for solar system generation, someone could add a field for planets and put in various random types of planets, even moons, starport, race, government, social, economic datasets if someone wanted to get detailed enough.
Okay. It does read in a text file if you want with the parameters but it’s not XML but rather the same format at it writes out. That’s how I made the Frontier Map. But having it being a standard format would probably be a good idea.
This is really a great tool. Thanks for making it.
I’m trying to add nebulas to the custom map I made with it.
As I’ll probably do it in gimp with an image, so I’m not sure it could be incorporated into the svg file, but if I figure out a way I’ll let you know.
I did my nebula in Inkscape as I described in this post: https://expandingfrontier.com/2019/05/expanded-frontier-map-update-2/. If you come up with a good way in GIMP I’d love to hear about it.
Although I’m a fan of star frontiers from way back in the day when it was an initial release I have been using this program to make Star charts for my Modiphius “Star Trek Adventures” campaign, set in the Sriginal Series era.
This looks like an awesome project… are you still working on it?
If one already has a list of coordinates that they wish to produce a map for, can they be imported or is it only random generation?
I haven’t worked on it recently.
If you already have coordinates, you can build an input file (in the same format as it writes out) with the coordinates you want and then load that into the program to make your map. That’s how I created the Frontier maps. I already had all the coordinates, just used them as input to the program.