Okay, in my last post on this topic, we generated all of the data needed to draw out a system map for the Fochrik star system. If you haven’t read the previous entry, you might want to but it’s not necessary. The next step is to take that data and turn it into the actual image. This post will cover that process. Let’s dive right in.
The Data
First a quick summary of the data for the system that we generated last time. While we won’t need all of this for the map, but it’s good to have it all summarized in one place. For generating the system map, we’re only going to need the orbital distance and the planet’s radius.
| Name | Orbital Distance (AU) | Orbital Period (hrs) | Gravity (g) | Mass (Earth) | Radius (km) |
| T1 | 0.19 | 687.46 | 0.33 | 0.0349 | 2,064.55 |
| T2 | 0.52 | 3,112.57 | 0.67 | 0.3373 | 4,468.50 |
| Forge | 1.13 | 9,316.45 | 0.81 | 0.6012 | 5,443.75 |
| Hum | 1.23 | 11,323.3 | 0.91 | 0.8139 | 5,991.92 |
| Larg | 1.61 | 16,957.2 | 1.12 | 1.4622 | 7,215.22 |
| J1 | 4.66 | 83,501.4 | 3.30 | 525.82 | 79,714.14 |
| J2 | 10.59 | 286,061 | 1.55 | 140.14 | 60,108.51 |
| ID1 | 16.58 | 560,391 | 0.14 | 0.0189 | 2,297.74 |
| IG1 | 18.53 | 662,106 | 0.97 | 19.902 | 28,62316 |
| ID2 | 20.53 | 772,144 | 0.06 | 0.0018 | 1,054.47 |
| IG1 | 26.01 | 1,101,096 | 1.02 | 18.472 | 26,919.75 |
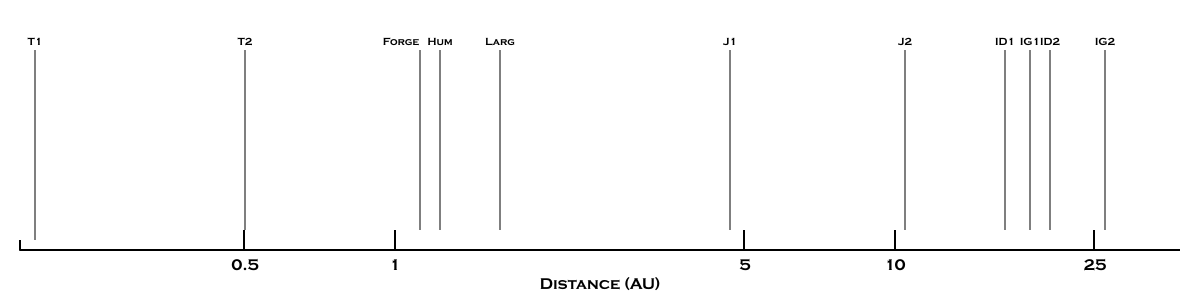
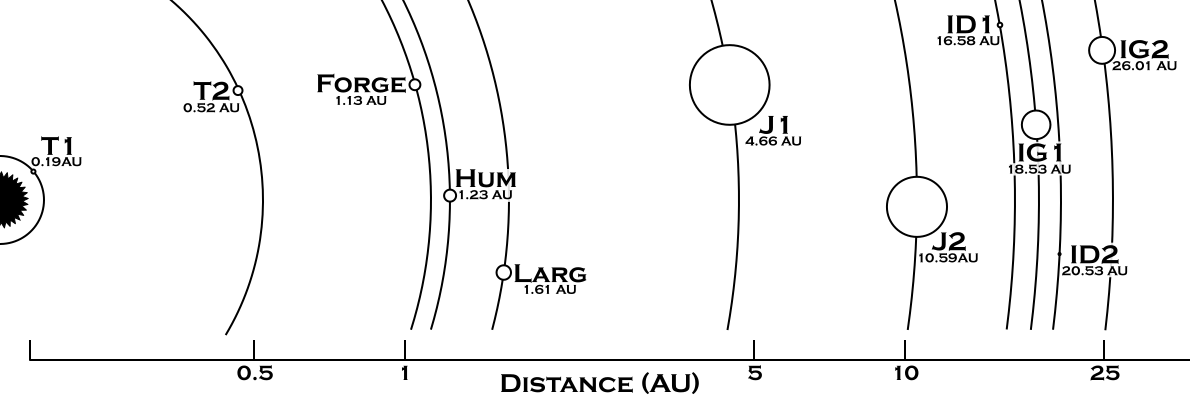
When drawing the map, we want the distances to be all on the same scale. However, we cannot use a simple linear scale in most cases as that would put all the inner planets right on top of each other if we want to see the outer planets on the same image. You can see this in the following diagram that has a linear distance scale.

As you can see, those inner planets are bunched up pretty close together while the outer planets have huge gaps. We want to spread out the inner planets while compressing the outer ones but still have the relative scale be correct. To do that we need to shift from a linear scale to a logarithmic one.
To get on a log scale, we are just going to take the base 10 logarithm (the ‘log’ key on your calculator) of each of the orbital distances and use that value to draw the distances. First I’ll present the numbers and then another simple drawing.
| Name | Orbital Distance (AU) | Orbital Distance (log(AU)) | Scaled Distance |
| T1 | 0.19 | -0.7212 | 14 |
| T2 | 0.52 | -0.2840 | 233 |
| Forge | 1.13 | 0.0531 | 401 |
| Hum | 1.23 | 0.0899 | 420 |
| Larg | 1.61 | 0.2087 | 479 |
| J1 | 4.66 | 0.6684 | 709 |
| J2 | 10.59 | 1.0249 | 887 |
| ID1 | 16.58 | 1.2196 | 985 |
| IG1 | 18.53 | 1.2679 | 1009 |
| ID2 | 20.53 | 1.3124 | 1031 |
| IG2 | 26.01 | 1.4151 | 1083 |
We can’t quite use the log(AU) values as the smaller numbers generate negative values (I’m not going to do a math lecture here. If you’re interested in why, you can check out this Wikipedia article). So we need to scale those numbers somehow. The scaled distance value in the table above was calculated by taking the log(AU) distances, adding 0.75 and then multiplying by 500. We’ll use these values to create the plot.
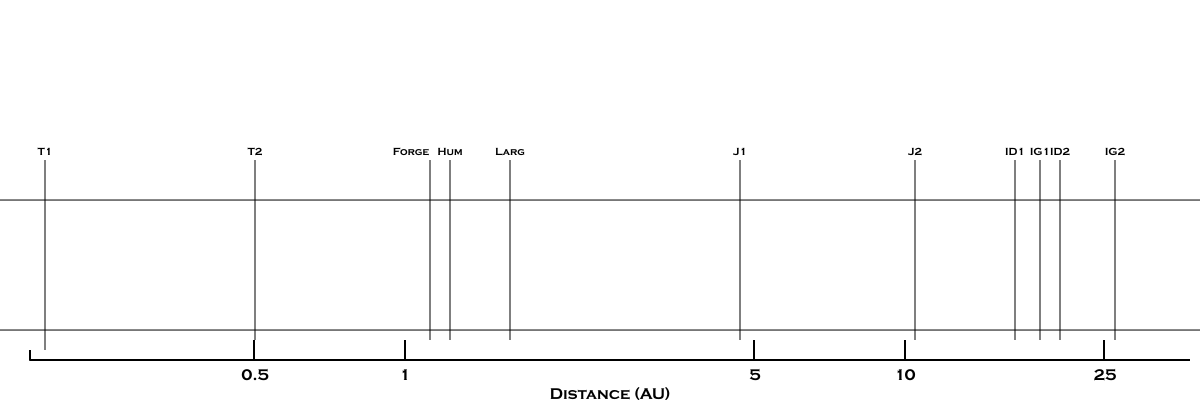
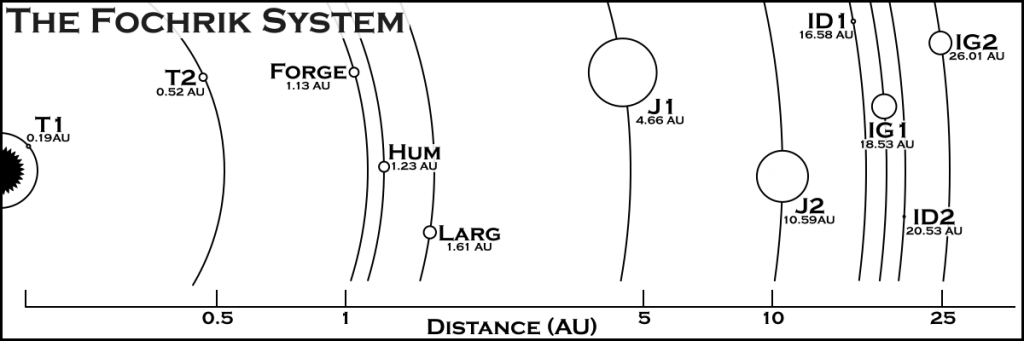
As you can see, the range of values is greatly compressed which allows things to be a bit more evenly spaced. The only issue with this scale is that zero (i.e. the position of the star) has a value of negative infinity so we’ll have to pick some arbitrary distance to separate them. However, since we’re just trying to show the relative position of the planets, that’s not too big of a problem. Here’s the simple plot we get:
This scale compresses the outer planets a bit but helps us spread out the inner planets which are the ones we’re more interested in anyway.
Drawing the Map
With the numbers above, we have all the information we need to create the map. The last thing to decide is if we are going do make a horizontal map (oriented like the diagrams above or the map in the Clarion Calendar post) or a vertical one (like in the Duergan’s Star post). For this map, I’m going to make a horizontal map simply because all of the “along the way” image will fit better into the post than a vertical one will. However, the process applies just as well to a vertical map, you just have to rotate everything 90 degrees.
I’ll be building the map in Inkscape, my vector drawing program of choice and it will be a simple black and white drawing so it shouldn’t be too complicated.
Here’s a video I made of the map building process if you want to watch it in real time, It’s about 53 and a half minutes long and completely unedited so you can see all my mistakes and fumbling around. If you don’t want to watch the video, I’ve described all the steps below.
Laying the ground work
To start, we want to set up the basic image and some guides for us to work with. I’ve decided to make the image 1200×400 pixels in size so I create a blank document of that size to work with. I also turn on a rectangular grid to help with position items. This grid will get turned on and off as needed during the drawing process.
I’m going to use the logarithmic distance scale for my planet spacing so I then import that image into my document and position it accordingly.
Finally, I draw a guide line down the middle of the image so I know where the center line is. After this initial setup, the image looks like:
I’ve shifted the imported image just slightly so that it’s 10 pixels to the right of where it was in the original. I wanted a little more space between the star and the first planet. Since I’ll be measuring the scaled distances from the left edge of the image, this means I’ll have to add 30 pixels to the values in the table above for the final radii of the orbits.
All of the above was done on the initial default layer. I then create three more layers: one for the orbits, one for the objects (star and planets), and a third for the labels. I like to work in lots of layers as it makes it easy to turn bits and pieces on and off and add in effects if needed.
The star and the orbits
The next step is to draw in the star itself and then start adding arcs for the orbits. The symbol for Fochrik is created using the star and polygon tool in the star setting with corners set to 30 and spoke ratio set to 0.8. This is drawn on the object layer.
Next I hide the objects layer and move to the orbits layer. Here I use the circle tool to draw in the first orbit. Clicking on the point where the center guide meets the edge of the image I then drag out the circle holding down the shift and the control keys until it reaches out to the position of the guide line for the planet T1.
Holding the control key down makes the circle drawn have integer ratios between the x and y directions allowing you get a proportional circle. Holding down the shift key makes your initial click point the center of the circle instead of the upper left corner of the box enclosing the circle. Once I have the circle drawn to approximately the correct size, I use the spinner boxes for Rx and Ry (the x and y radii) to set the exact radii (44 px in this case). The fill of the circle is set to transparent, the stoke is set to black with a thickness of 2 pixels.
Inkscape allows you to draw off the edge of the image so we drew a whole circle for this first orbit. Since we will be copying and scaling this up, we don’t want our circles going way off to the left. We can turn the full circle into an arc by grabbing the small circular mark on the drawn circle (it’s at the 3 o’clock position) and moving it clockwise to break the circle. I move it down to just past the 6 o’clock position. Then I go back and grab the other small circle node at 3 o’clock and move it up to just before the 12 o’clock position. This gives us a half circle which is all we need.
Now it’s just a matter of duplicating that arc and setting the correct radii for each one. As we move out we’ll want to adjust the size of the arc so it’s not sticking up well above or below the edge of the image just to make things a little cleaner on our drawing canvas.
We can duplicate a selected object by pressing Control-D. Then we just go up and set the Rx and Ry values based on the scaled distance values in the table above (remembering to add 30 to each one). You have to remember to have the circle tool selected while you do this or you can’t set the radii.
Once that is done, we have an image that looks something like this:
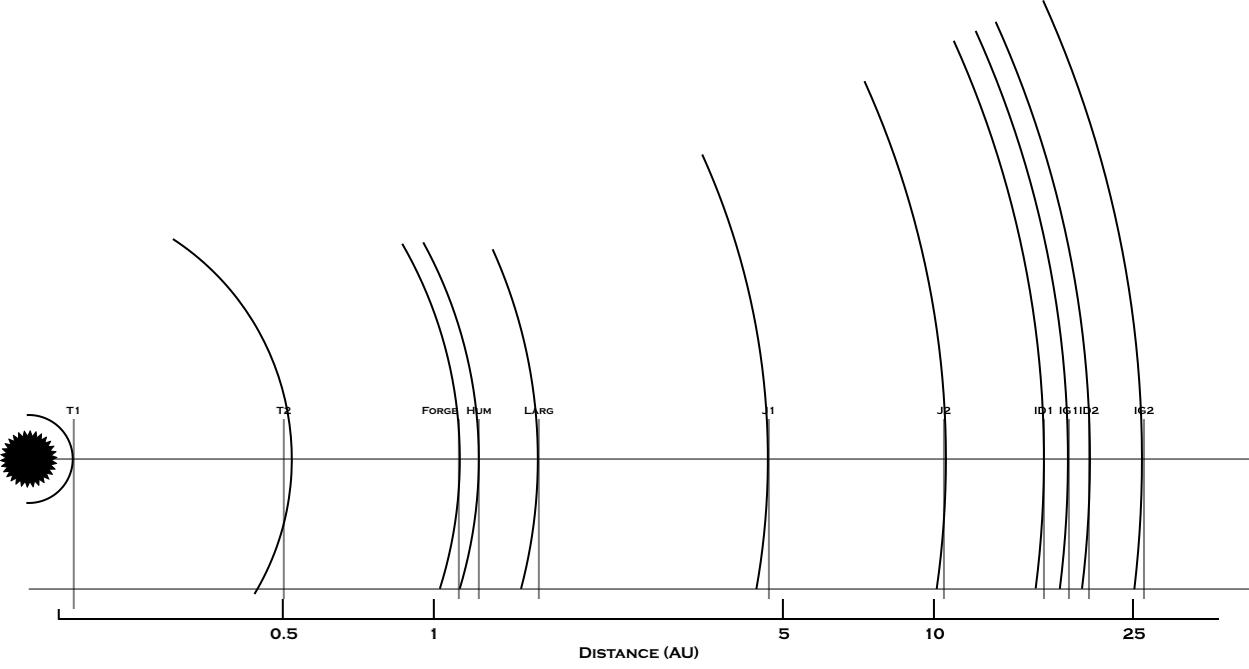
Notice how the arcs are going high. They will be cut off when we export the final image. They were originally also going low as well but they have been adjusted (at a later step) and I didn’t export an image while I was drawing them.
You might also notice that the arc for the planet T2 is not lined up with it’s guide line. That is because as I was drawing it, I noticed a discrepancy between where the guide line was and where the arc was drawn based on the scaled distance values. I originally though there was an error in the scaled distance but it turns out I just drew my guide sketch wrong. It’s always good to double check your work.
Drawing the planets
We’ve got our orbits, now we need to draw the planets. This will be done on the planet layer so we switch to that layer now.
Like the orbits, we want the planets to all be on the same scale. This obviously can’t be the same scale as the orbits or we wouldn’t be able to see them since they’d just be dots on the page. To pick the initial scale, I just let the radius of the circle we’re going to draw be equal to the radius of of the planet (in km) listed in the table divided by 2000. I computed each of these values and wrote them down on a piece of scratch paper to have them handy.
Depending on how you have Inkscape set up, when you draw in the first circle, you’ll notice that you just get an arc instead of a full circle. That was my case as I have Inkscape set to remember the last setting for the tool and use that instead of resetting to the default. I find that more useful. But we need to reset the tool to draw circles. This is done by finding the Start and End boxes (up by the Rx and Ry boxes) and setting them to 0 and 360 respectively. Now we’re drawing circles again. Also you’ll want to set the fill to white instead of transparent.
I then just move to an arbitrary point on each planet’s orbit, draw a small circle and then set Rx and Ry to be the values determined for that planet. It doesn’t matter exactly where you draw them as we’ll go back and properly position them once they are all drawn.
When you start doing this, you’ll quickly notice that the scale we’ve picked is simply too small for the small terrestrial planets. In the case of a few of them, you can’t even see the disk as it is smaller than thickness of the line we drew for the orbit. To solve this we simply double the radii of these planets. However, that would make the giant and Jovian planets too big if we doubled them as well. So we’re just going to have to have different scales. The terrestrial and ice dwarf planets will be to scale with each other as will the giant and Jovian planets but the smaller planets will be twice as big as they would be if they were to scale with the larger planets.
The last step of drawing the planets is to place them at an appropriate position on their orbit circle. There are two requirements here. One is that the disk of the planet should be centered on the orbit line. The other is that for planets with close orbits, they are spread out across the image so that when we add labels there won’t be any overlap. To make this easier you should turn off the grid that we set up at the beginning so the software isn’t trying to snap your circles to positions you don’t want.
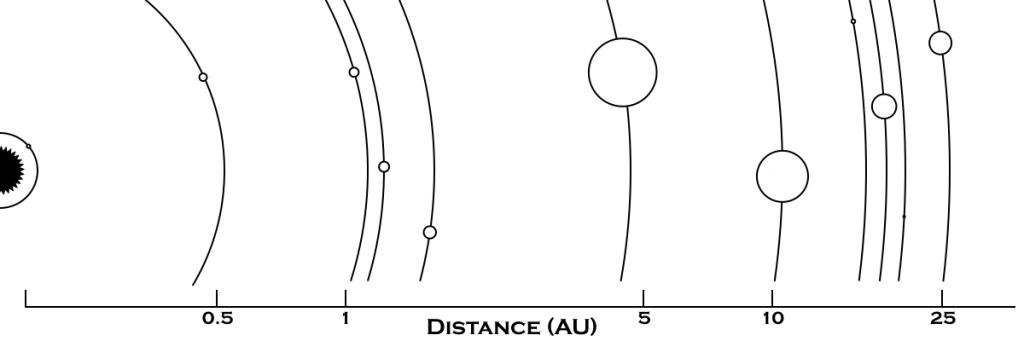
Once that is done, we have an image that looks something like this:

You’ll notice that even doubling the scale, some of those planets are pretty tiny. In fact, you might not even be able to see ice dwarf 2 unless you click on the image above to get the full sized one. But that’s okay.
Adding labels
The next step is to label everything. There are a few things we want to put in our labels. The most obvious is the name of the planet. I still haven’t come up with official names for the planets but that doesn’t matter for the purposes of demonstrating the mapping technique. The other thing we need to do is add the scale for the system map. Finally we’ll add a label for the system. I’ll be using the Copperplate Gothic Bold font for my lettering.
Let’s start with the scale. If you watched the video, you’ll know that I actually did this way back at the beginning of the process. Since it was already there in the imported image, all I had to do was trace it. Once it was drawn in and had the numbers, I put the “Distance (AU)” label on and then moved everything down as close to the bottom of the image as I wanted it.
The labels on the the scale are drawn with a height of 16px for the numbers and 20px for the label. What you choose is arbitrary and it should be picked to match the size of the drawing. You don’t want it too small but you don’t want it too large either.
However, at this point, I didn’t like the orbit lines crossing over the scale and I went back and adjusted them so that they stopped just before touching it. If you look closely in the previous image, you’ll see another guide line that sits just above the scale that all the orbit lines touch. I drew this line in and then, using the circle tool, adjusted the end of the arc of each orbit line to just touch that line, which is why they don’t extend below the image.
Turning off the layer with the guides and the scale image gives us the following at this point. I’ve also now only exported the actual drawing so everything is trimmed appropriately.
Next we label the planets. For each planet I’m going to put the name in using a 20px high font and then centered under the name, put its orbital distance in a 10px high font. Again still using Copperplate Gothic Bold. I had originally intended to just type both and then change the font size of the distance but found that I couldn’t adjust the vertical spacing like I wanted to. So instead I created two text objects, one for each line, used the alignment tools to get them lined up, and then grouped the label for each planet into a single object so I can move it around easier later.
It doesn’t really matter exactly where you put the labels to begin with as you’ll be moving them around once they are done and you have their exact sizes. Just go through and add them for each planet. Then, once they are in the drawing, move and position them so that you like the placement. This may also involve moving the position of the planet’s disk on the orbit line to get a spacing you want.
Typically for the smaller planets, I like to place label so the center of name is aligned with the center of the disk. For the large planets, I tend to set it to the lower left or right corner depending on the exact positioning. I just do this by eye. You want to avoid having the text run over the orbit lines as much as you can but in some cases it’s unavoidable. Just place the names where it looks good to you. On a vertical map, I’ll often try to center the name of the planet under the planet’s disk.
Now we have to deal with the text that is overlapping the orbit lines. This often makes the text hard to read so we need to mask out the orbit lines under the text. Your text layer should be positioned above the orbit layer. If it isn’t you’ll need to move it up in the layer stack. What we’ll do is draw some white rectangles to hide the orbit line below the text. I like to set their opacity to about 75-80% so the orbit lines slightly peek through but you can make them fully opaque if you prefer. Drawing the rectangles can either be done on a new mask layer that is placed directly under the labels layer or in the labels layer itself.
In this image I drew the rectangles directly into the labels layer. Using the rectangle tool I just drew in a small rectangle over the orbit lines in each location there was overlap between the text and the lines. You’ll want to make the rectangle extend just a bit below and above the text. Exactly how much depends on how much space you want between the lines and the text and is a matter of taste. As you draw the rectangles, they are placed above the text so you need to send them to the bottom of the z-order for the layer so they are behind the text instead.
If you draw on a new mask layer, then you don’t have to worry about moving the z-order of the boxes as they will all be between the orbit lines and the text. You also don’t have to worry about the opacity on the individual boxes but can adjust the opacity of the entire layer all at once. This is typically how I do the masks but for some reason didn’t on this particular drawing. Probably due to the fact that I was recording and it slipped my mind.
We are almost done. At this point our image looks like this:
Finishing touches
The only thing left to add is the label for the system, a border, and a white background.
We’ll put the label in the upper left. We want this to be large so we’ll use a 32px high font. We’ll also need to add a mask as it will be overlapping the orbit lines. I considered simply adjusting the orbit lines to end below the label but decided to leave them in and mask them off.
The border and background I did with a single object. You may not have noticed, but all of the images so far have had a transparent background with just the objects drawn on it. This can cause some issues depending on how the image is rendered so we want to add a solid white background.
To do this I make a new background layer that sits at the very bottom of the layer stack. On this layer I draw a single large rectangle that stretches corner to corner across the entire image. I set the fill to white and the stroke to black with a 6px thickness. Due to the way Inkscape draws the stroke, half of that will be off the final image giving a 3px border. If you want it thicker or thinner, simply adjust the stroke width.
And now we’re done. Here’s the final image:
If you’d like to look at or play with the original SVG file of this map, they you can grab it here:
Other touch-ups
Giving the planets some character
For this demo, I didn’t do anything special with the planets themselves. If you wanted to, you could add in cloud bands or rings on the giant planets to give them a little bit of character. Especially if they have features called out in their descriptions. I didn’t have any special descriptors so I left them as simple circles but that could be added in later.
The FTL Horizon
If I was doing this map for FrontierSpace, the other thing I would add in is a dashed arc at the position of the FTL Horizon, which in that game is the distance you need to be from the star in order to engage your Nova Drive to travel between the star systems. That would be an important bit of information for the map to include.
Asteroid belts
I also didn’t add in an asteroid belt in this system. If I did then I would determine the distances for the inner and outer boundaries of the belt and draw orbit circles on the guide layer at those distances. Then on the object layer I’d go in by hand and draw in all the asteroids. I work on a 2-in-1 laptop that has a stylus so I can actually flip my laptop into tablet mode and draw the asteroids with my stylus right on the screen. I find this much easier and faster than trying to do it with the mouse but it can be done that way (and I’ve done it that way in the past). There’s a bit more to it than that so I might do a mini article on drawing in asteroid belts.
Final thoughts
And that’s everything. I think the map turned out pretty well. I was actually surprised it only took a little less than an hour to draw it out once I had all the data. All told I probably spent about 2-2.5 hours creating the data and making the drawing. It would have taken a bit longer if I had had an asteroid belt to include or added details to the planets but that gives you an idea of the effort involved. It actually took me longer to do these two blog posts (5-6 hours total) than it took to actually do the work.
I still have one more post on the calendar system to do and that will come in March. I’d like to hear your comments, questions, or any suggestions you have about the process. What wasn’t clear? What would you like more information on? Did you try this yourself? If you did, share your results. Let me know below.
