I had planned to to have the next part of the module campaign write-up as the post this week, but that’s taking me a bit longer than I had planned and I spent more time than I should have on updates to the Expanded Frontier Map so I’m writing about that instead.
As I said in my last State of the Frontier post, one of the things I want to work on this year is a full color version of the Expanded Frontier map. So while I was on vacation, I fired up my laptop and started on that. This post will detail some of the things I’m working on and what to look for in the future.
Corrections
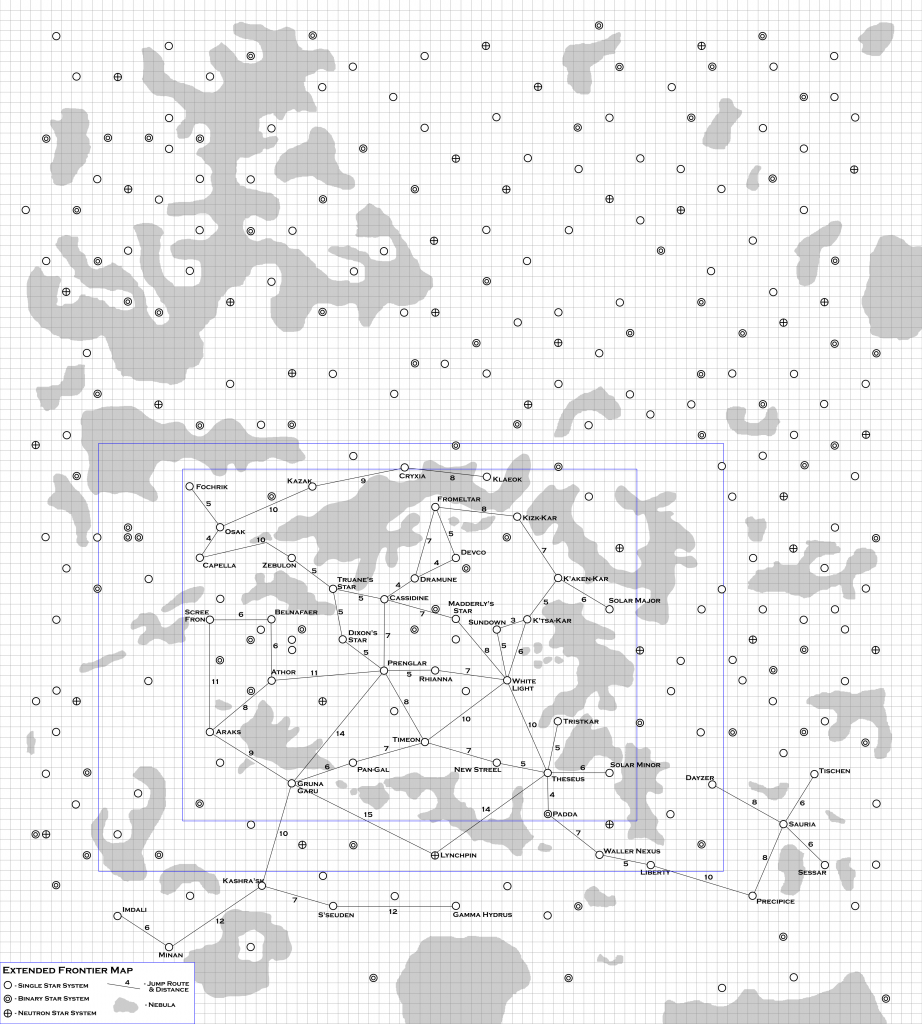
The first thing I had to do was fix some errors I noticed in my original expanded map. Mainly, I had left off some labels on a few of the star systems. I haven’t posted a version of the map with those labels yet but will in the future. So I added those in.
The other omission I had to correct was one I noticed in creating entries for the Detailed Frontier Timeline. I was missing a necessary jump route for the sathar. So I added that in as well. Again, I haven’t posted that version of the map so the correction just appears on my “Referee’s Copy” at the moment.
Next, I decided to shift the system I was labeling as Belnafaer (from the SFAD5: Bugs in the the System module) to the same one that the TSR folks did in the Frontier map in Zeb’s Guide. The choice was arbitrary and both my selection and theirs matched the description given in the module. I figured it was better to disagree as little as possible with the “canon” material. (I’m still not moving Starmist or Rhianna though).
Finally, I discovered that the labeled distance from Madderly’s Star to White Light was wrong. The map labels it as 6 but it is actually 8. (The map in Zeb’s Guide has it correct but the one in the Dramune Run is wrong as well.) This was actually discovered in making the color map as described below. So I fixed that. It’s funny, but I’ve been playing Star Frontiers for 35 years now and never noticed that typo.
Those were the corrections I made. While you can’t see two of them, this is the resulting map:

I also fixed up some internal errors, mostly labels on the wrong layers, but that has no impact on the map itself. I had planned to post the version with all the star designations, but in looking at them, I realized they need some cleaning up on their positioning so it wasn’t quite ready to go for this post. I need to spend about an hour tweaking things.
Moving on to Color
As I mentioned before, I had written a program to randomly generate sector maps. The stars were represented using the symbols in the chart to the right. The second column showing how multiple star systems are represented.
As written, the program only generated random systems and wrote basic map data out to a file. What I needed was the ability to read in that output file and build the map from the data instead of randomly.
So that’s where I started. I had an output format, I just needed code to read that and convert it back into data that could be used for drawing the map. Along the way, I realized that I needed to change some things about the way the data was represented and stored in the program and output file as we well as needing to add storage for things like the name of the system.
Another thing I had to change was the printing of the Z-coordinate. The random map generation process creates star systems in 3 dimensions and labels each system with its Z-coordinate above or below the plane of the map. Since for the Frontier Map (at least initially) everything is on the same plane, there was no need to print little zeros by each star system. So I added a flag to turn off printing that coordinate on the map.
Generating the Data for the Frontier Map
With the code now ready to read data from a file and draw the map. I needed to generate the data for the Frontier map. As I’m building and testing the software, I figured I’d work with a smaller map so I’m just using the original Frontier Map from the Alpha Dawn rules.
There are 51 systems on that map. I determined the coordinates on the map (as the software sees them, currently measured from the upper right corner – that may change), and wrote those into a data file. That was the easy part.
The next step was to get spectral classifications for each of the systems. The inhabited systems were relatively easy. In the listing for each of the systems in the rule book, it gives a color for the star. At this point the program isn’t refined enough to break down the spectral types so a G0 star is represented the same as a G2 or G8 star. So I only had to approximate. Yellow stars got a G0 designation, orange stars got a K0 designation, white stars got an F0 designation, and red stars got a M0 designation. I used those since those are the spectral types that the program currently understands.
Next I went through and added in the spectral types for the stars that host the various planets of the modules and added in designations for them. Then, I had to go in and add in the designations for star systems in the Rim that were labeled in Zebulon’s Guide. Zeb’s Guide give full spectral types (F7, G3, K2, etc.) but for now, I just used the spectral type letter and not the number since the program can’t process those yet. (Note: if you compare the spectral types from Zeb’s Guide for the original Frontier worlds to the colors given in the Alpha Dawn rules, they don’t always agree. That’s something I’ll have to resolve later. For now, AD takes precedence.)
That covers all the “explored” systems. Note that I didn’t use the Zeb’s Guide data for the megacorp systems. I can always go back and add that but I don’t use those systems in my game. Finally for all the other systems, I had to randomly generate spectral types. To do that, I just generated a map with random values and copied the appropriate values over for the binary and single systems, only selecting single systems that were M stars or brown dwarfs. There are already way too many F, G, & K type stars in the region so I wanted a sprinkling of the other types. I also added the neutron star designation by hand for that system on the map.
Then it was time to actually run the program and make the map. It worked fine but looking at it I noticed a few problems with the jump distances. Several were too small by one and one was too large. Looking closer, I realized that while I was calculating the distances correctly, it was rounding wrong on display so I fixed that which corrected the distances displaying too small. That just left me with the one jump distance that was too large, now by two instead of one. This is where I discovered the typo on the original map for the distance between White Light and Madderly’s Star. The program was giving the correct distance but the original map was wrong.
I also decided that the symbols were a bit too small. The size I was using worked fine in the random map when there was the possibility of two systems in the same grid box with different Z-coordinates but for this map, where that couldn’t happen, I wanted the symbols larger. So I built in a scaling parameter in to the program allowing me to control the scale.
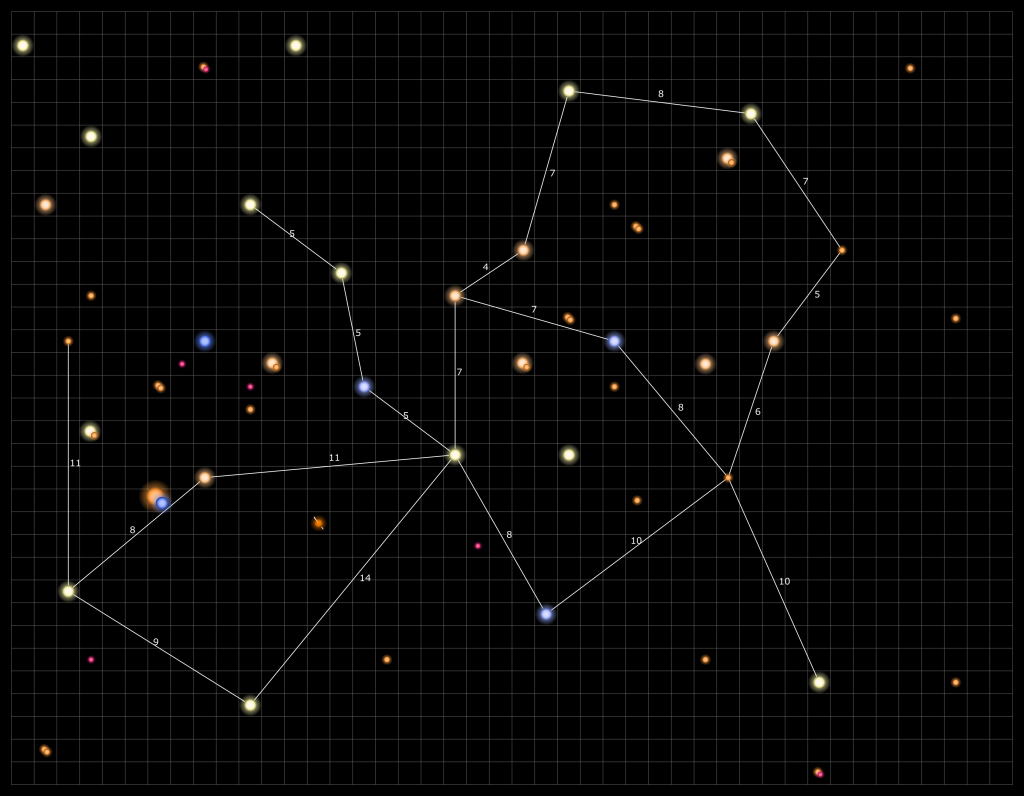
With those changes, we have the following initial color map of the Frontier.

You’ll notice a few things right away. First, there are no names on the map. Second, there are no nebulae. Right now the program doesn’t do those things.
Names will be relatively easy. I have the data, I just need to have the program add them to the image file. I need to research how to set fonts but otherwise, it’s straightforward.
Nebula are a whole different story. And may have to be added in by hand after the fact. Either way, that is going to be a complicated process and require some learning and work (and artistic ability) on my part.
If you look closer, you’ll notice that the positioning of the numbers along the jump routes are not optimal. It works for most of the jumps but for connections that are at an approximately 45 degree angle running from upper left to lower right, the number comes out too close (and sometimes overlapping) the line. I’ll need to fix that. That cleanup will probably be done by hand.
The program generates SVG files where each item is an object that can be manipulated allowing me to tweak things by hand. That was done intentionally as I knew the program wouldn’t be able to get everything perfect. That will be even more apparent once the names are added. I suspect that many of them will have to be moved to not overlap the jump routes.
The other minor thing is that the scaling factor I added wasn’t able to affect the size of the jets coming out of the neutron star. I need to either figure that out or, more likely, reduce the size back down for that spectral type and ignore the scaling. We’ll see how that goes.
Next Steps
The easy next steps are adding in the names of the systems and fixing the scaling on the neutron star.
After that, what I want to do is add in a way to handle all the various spectral types. The colors I picked don’t exactly represent the colors of the stars. They are close, but were chose for aesthetics rather than complete accuracy. Almost everything would be white with just some color tinting if we went for accuracy. I did that originally but didn’t like the result. I want to add code that will extrapolate between the given colors for the various spectral types’ number values to give various shades to the stars.
After that, I plan on tackling the nebula. I want to see if I can programmatically come up with something passable to start and then refine it.
The Code
If you want to play with the code, you can find it on my GitHub repository. It’s written in Python and right now isn’t the most user friendly. I need to add some in-line documentation as well as add features that will make it more usable directly from a command line instead of having to modify parameters in the code itself before running. That is another future project. But if you want to dive in and play with it as is, feel free.
