The Expanding Frontier

Creating Sci-fi RPG Resources

  • Home
  • Order a Map
  • Order Miniatures
  • Supporters
  • About
  • Bio

Category Archives: Maps

The Rael Core Sector

This is another map done using my map generation software. As I mentioned in my last State of the Frontier post, I’ve been itching to make a map of the area of space my book, Discovery, is set in. I’m (very) slowly working on a sequel to that book as well and so want a nice map to go with them.

Unlike the Frontier map, this map has a third dimension with the stars having positions both above and below the plane of the map. This area of space is 40 lightyears wide, 40 ly tall, and 20 ly thick.

The Original Map

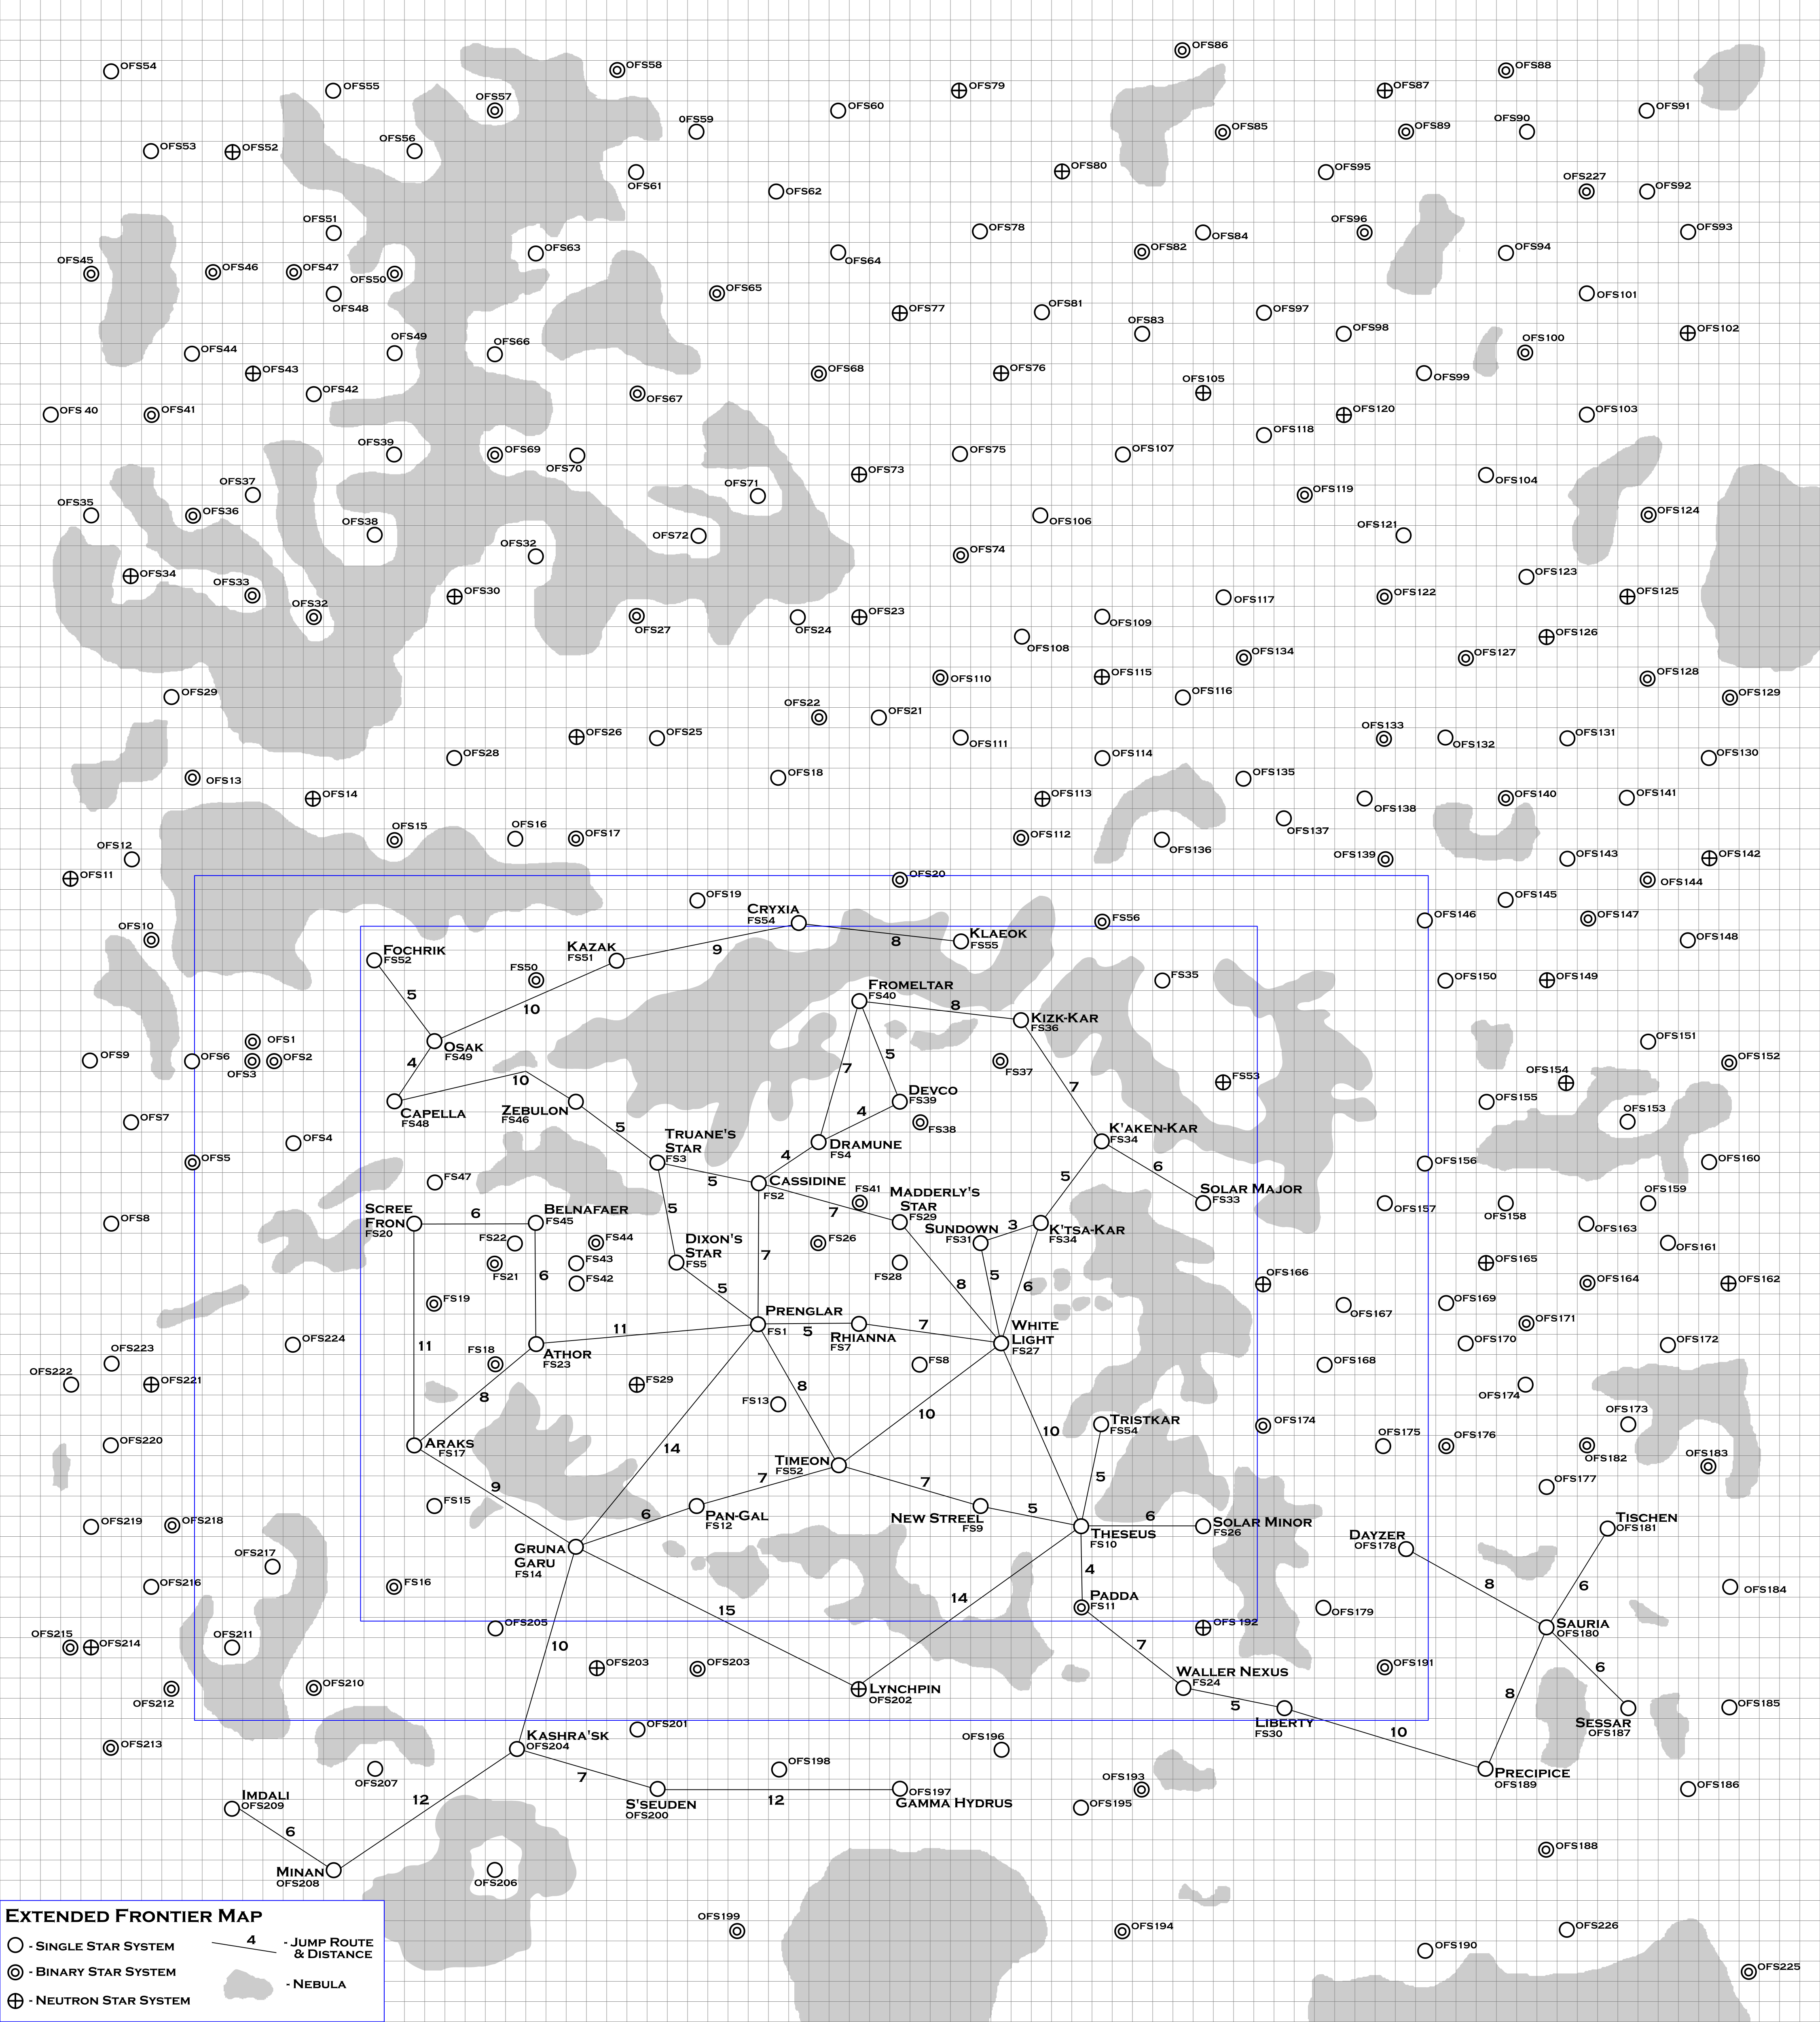
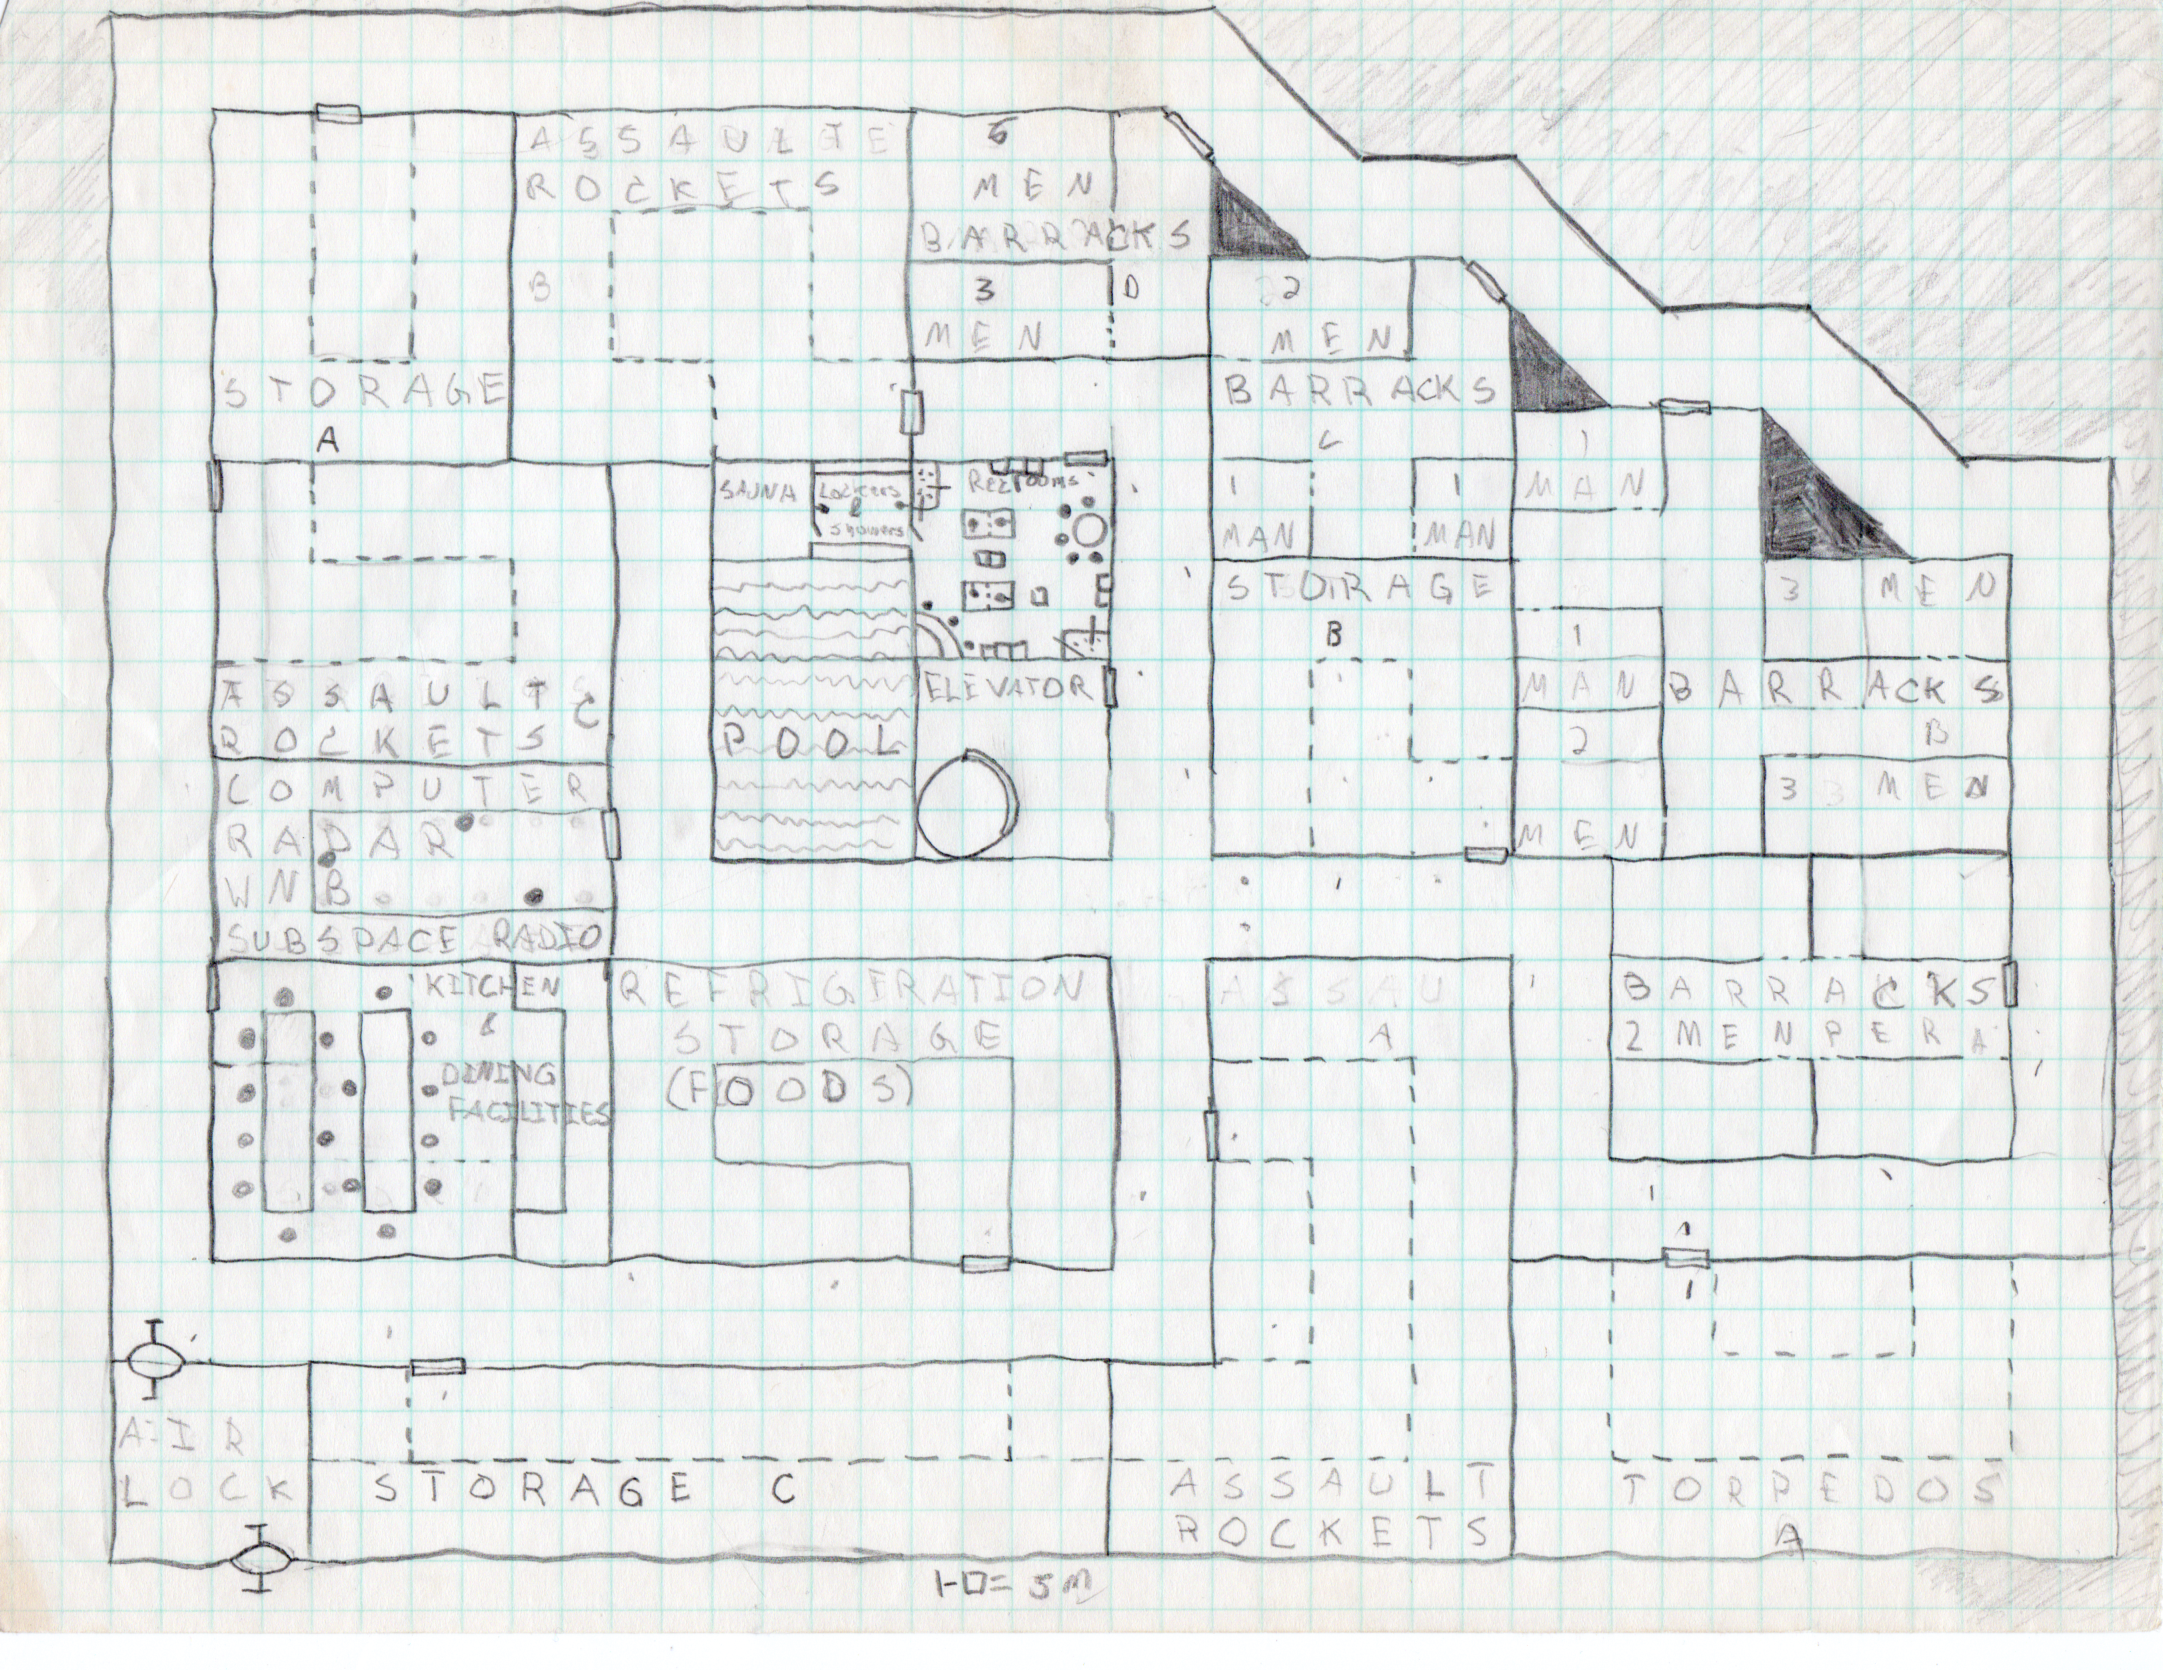
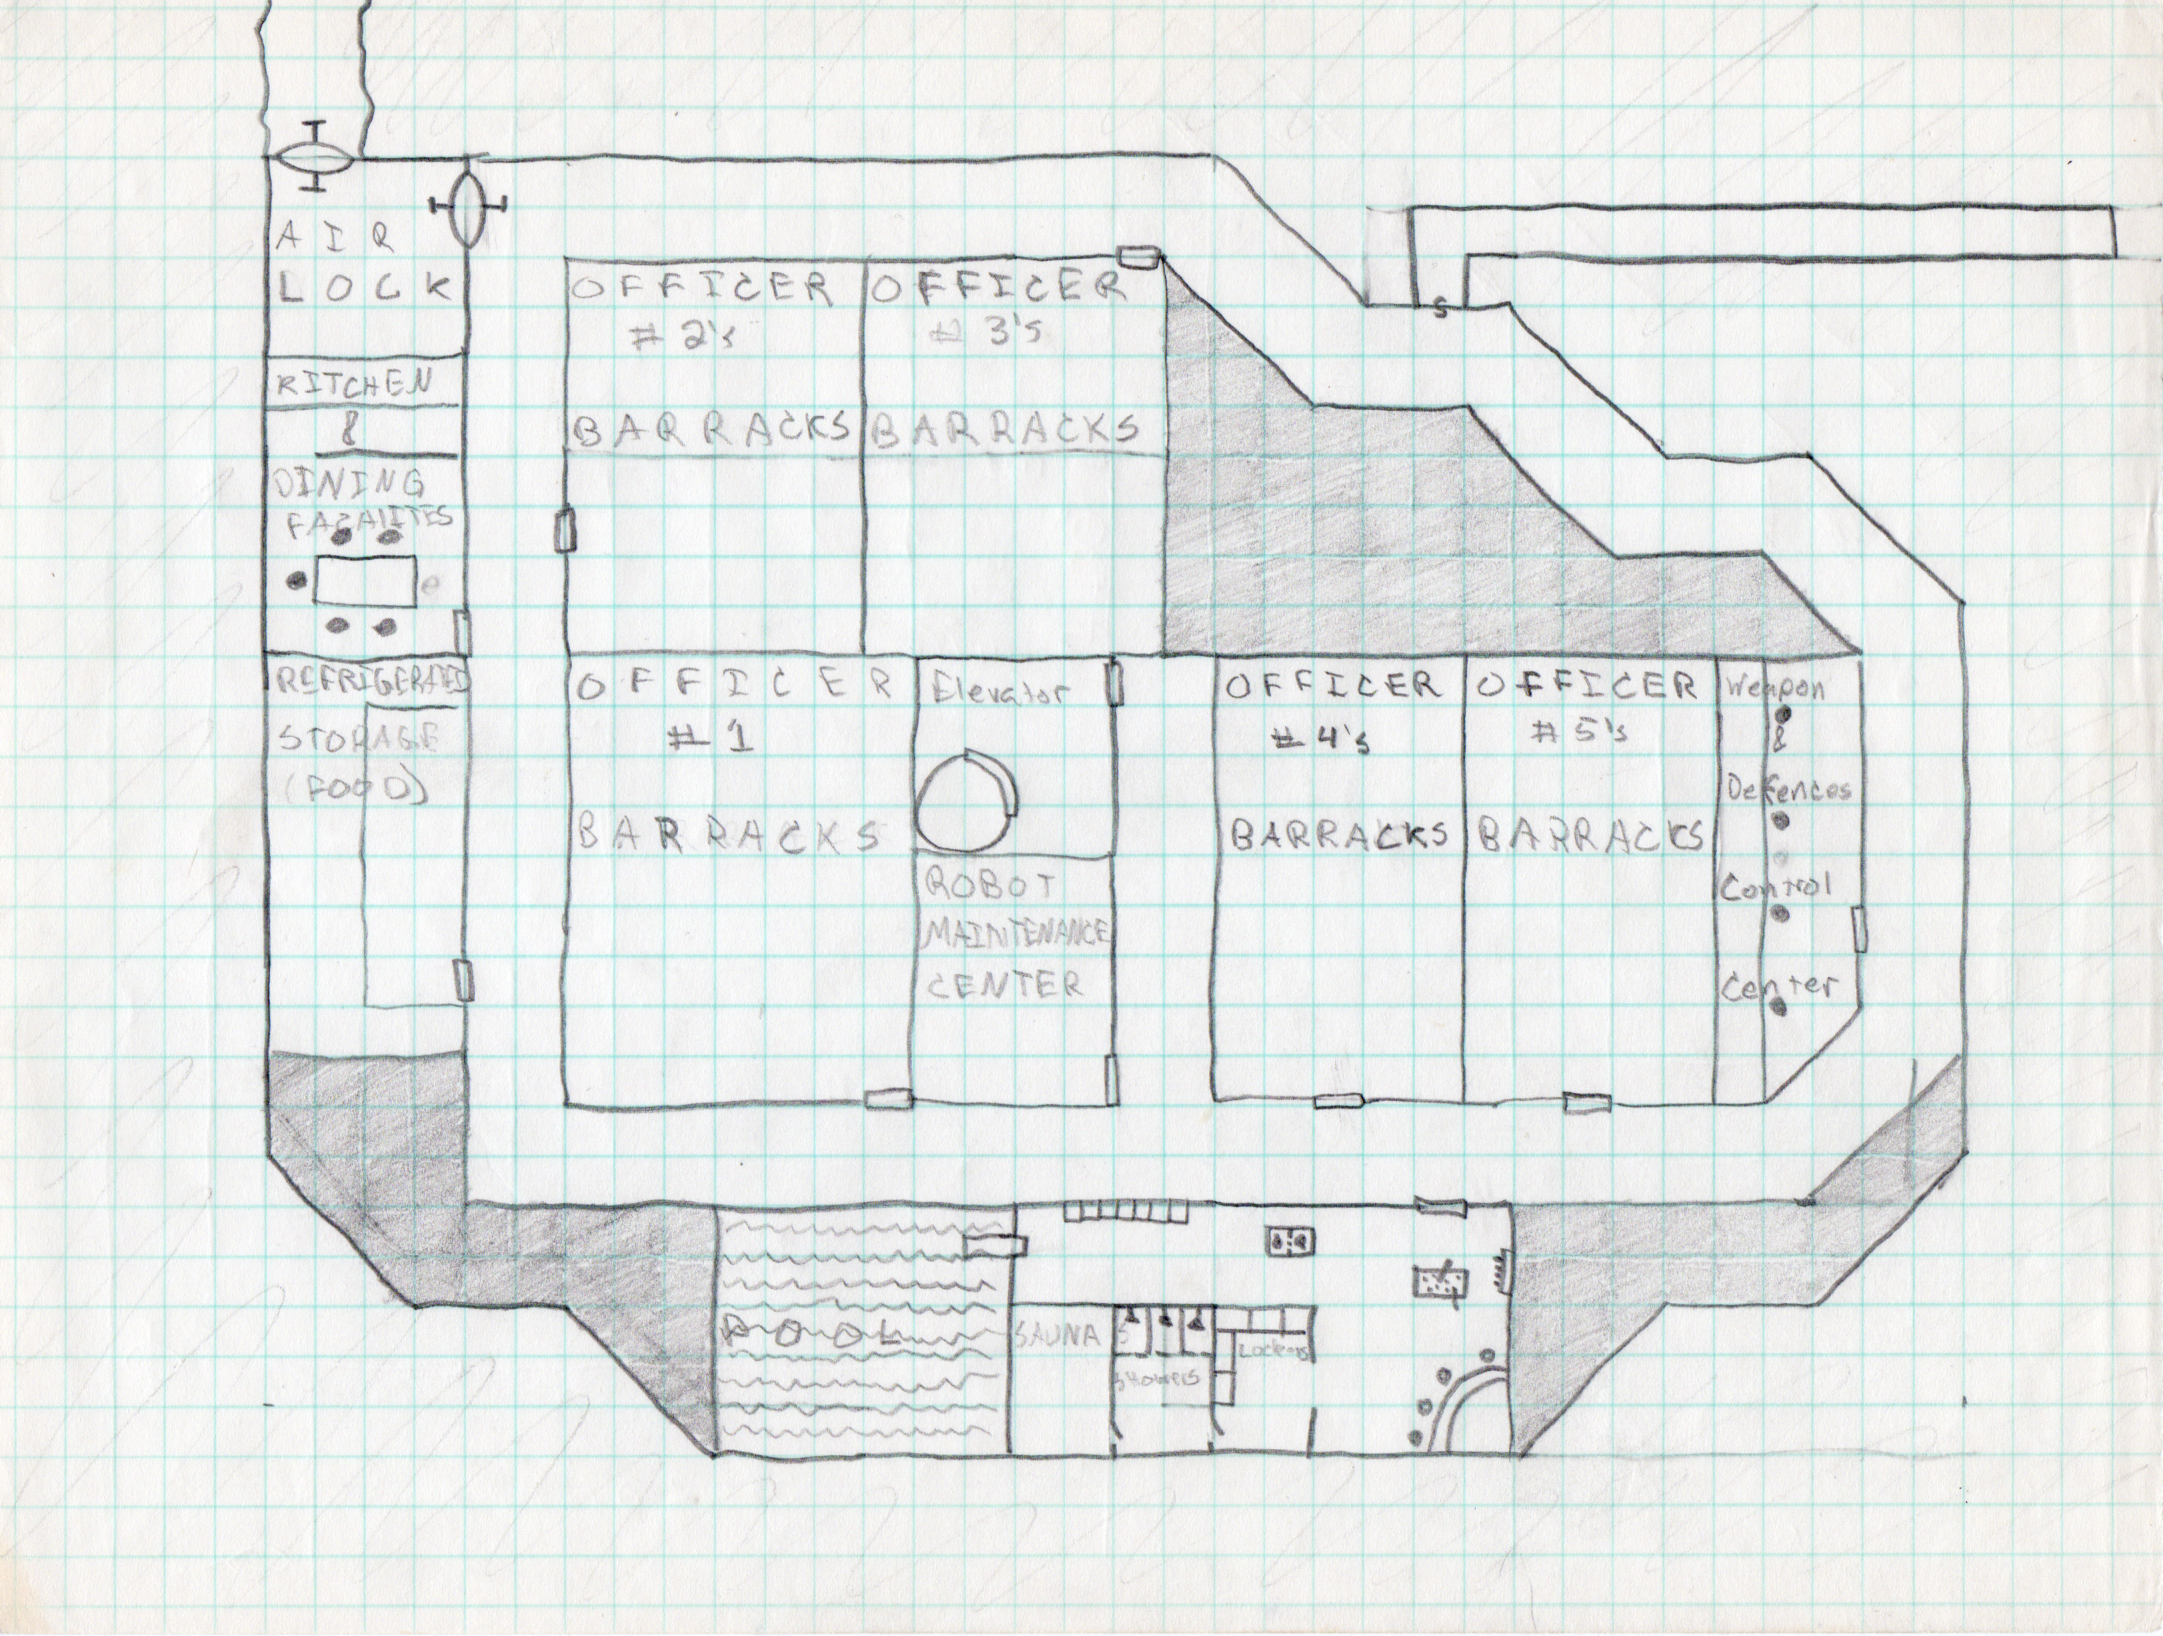
I have a hand-drawn map of the sector that I made years ago (2010-2011). I randomly generated the positions in this map via rolling a bunch of dice in small 10x10x20 ly sections (d10 for x, d10 for y d20-10 for height). I had sat down and worked out the approximate stellar density for the region around the Sun and it worked out to 8 stars in that 10x10x20 volume, so I just rolled eight positions in each section of the map. There are 16 such sections. And somewhere along the way I rolled an extra star system since there are 129 systems on the map and not 128. Here’s a copy of that hand-drawn map:

Scan of my notebook with the map in it. The x=5 line is duplicated across the binding to make sure I don’t mess up when determining positions. Click for full resolution.

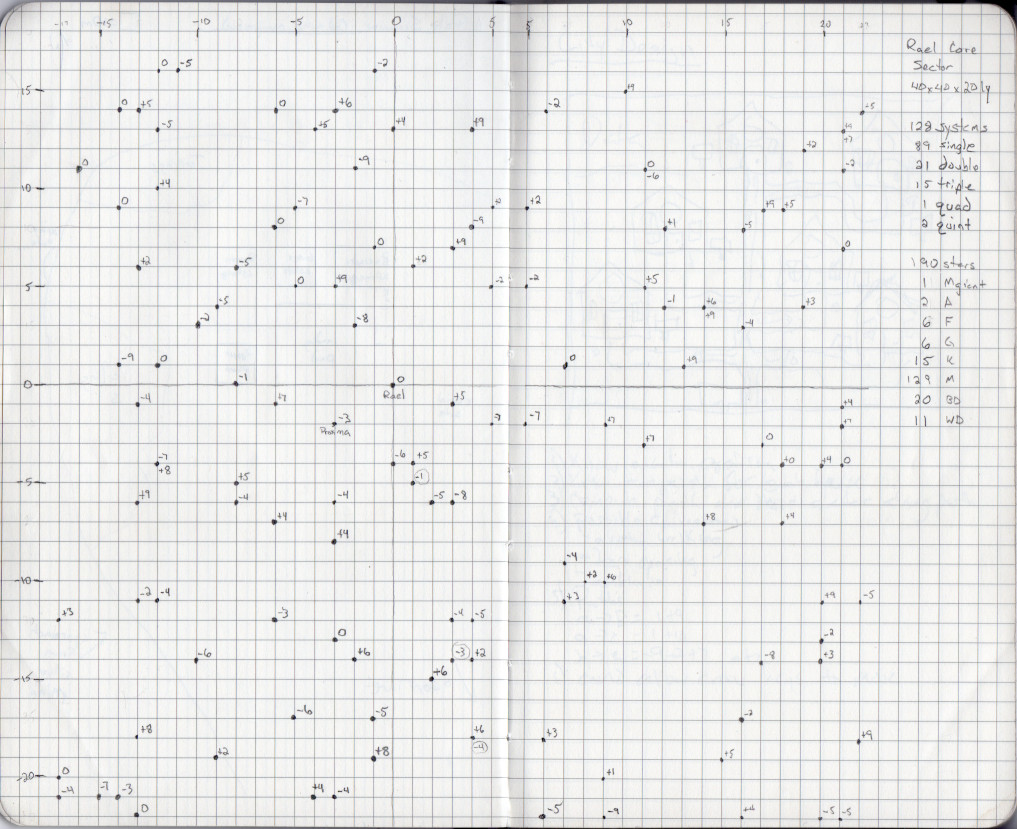
The stellar type tables that I implemented in my program come from this time period as well. I worked them out originally to generate this map. I even rolled up the composition of each of the star systems by hand back then using those tables and have a list of the systems generated. Or at least a composition for 128 systems. They weren’t assigned to specific positions on the map, I had never really gotten around to that part.

And apparently I was still using the original map, not the one copied into my notebook, when I originally plotted out the sequel novel as the notes for that novel are on the very original map as well.

One thing you’ll notice is that the “central” star of the sector, Rael, is not at the middle of the map. I’m not sure exactly why I didn’t just arbitrarily put it there. I do remember that I created the map, and then picked the system closest to the center to be on the central plane vertically. Either that or I got lucky and there was a star near the center.

Since the people in that star system are making the map, it would make more sense if it was at the center but that’s not what I did and I didn’t feel like changing it. The more I think about it though, the more I might go back and do that. I’d just shift all the stars down and to the right by 2 positions and wrap everything that falls off the edge to the other side.

In any case, that’s where the map stood for many years. Until I decided to make the full color version.

The New Map

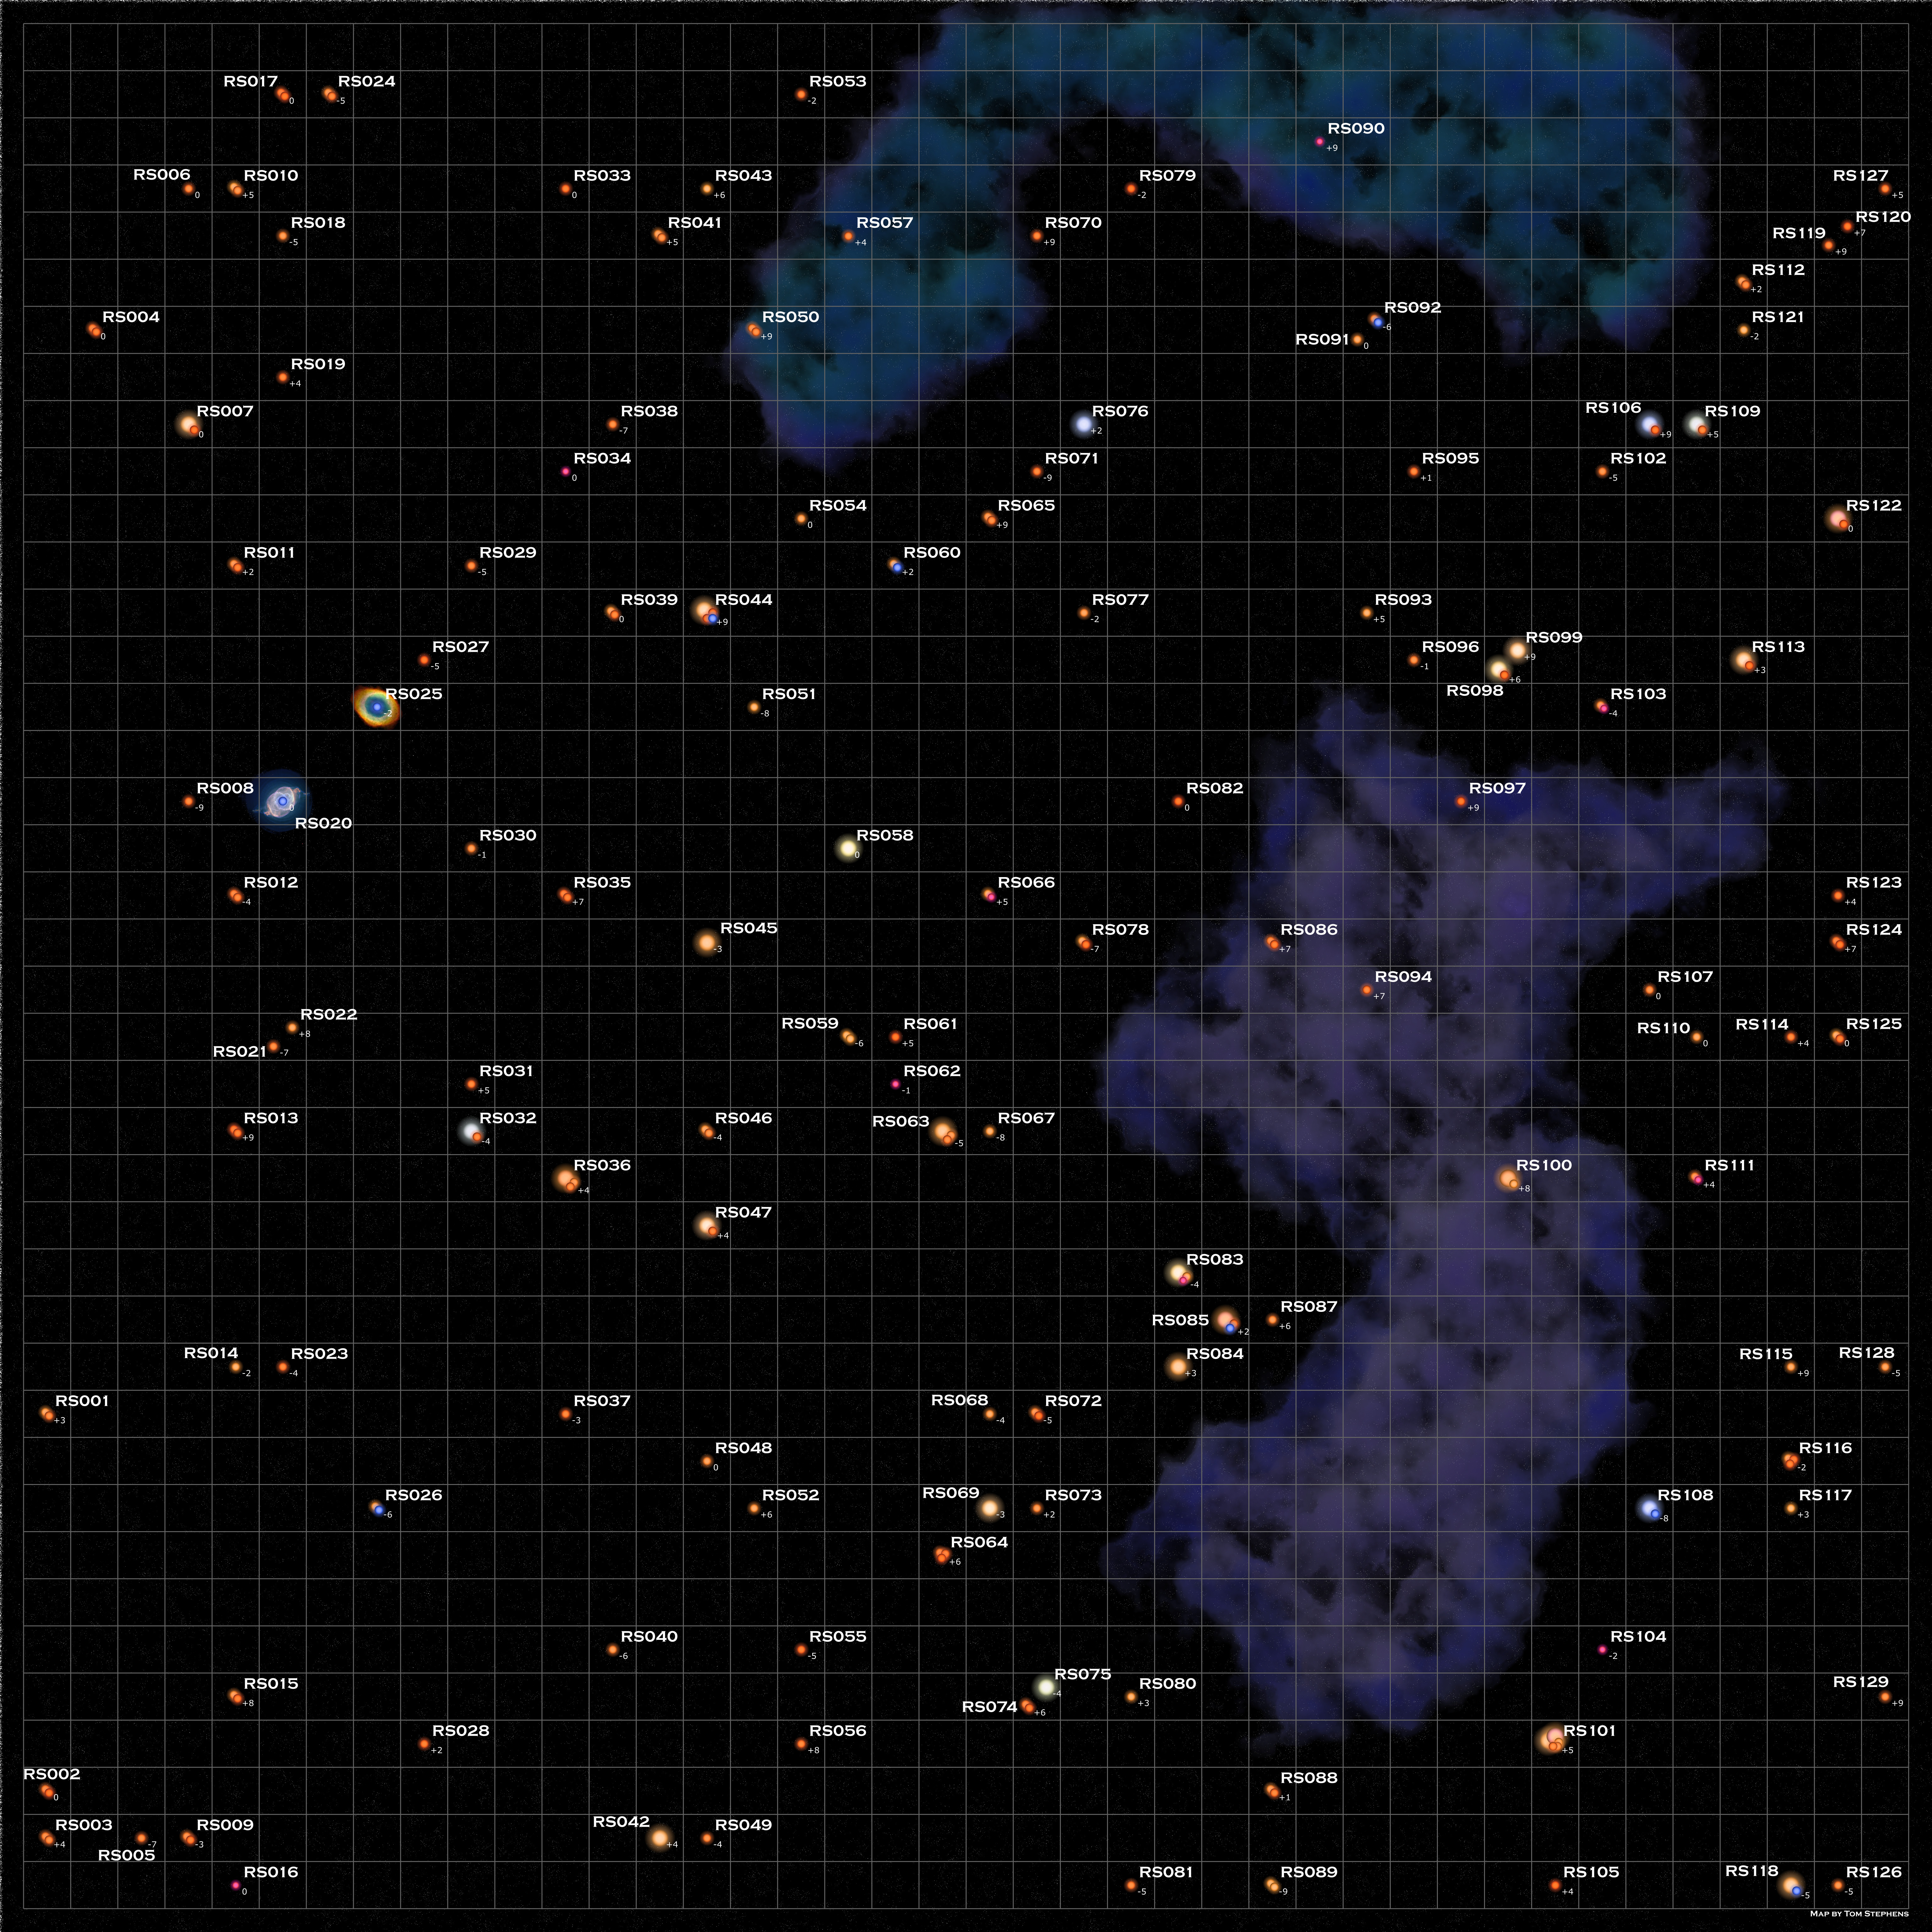
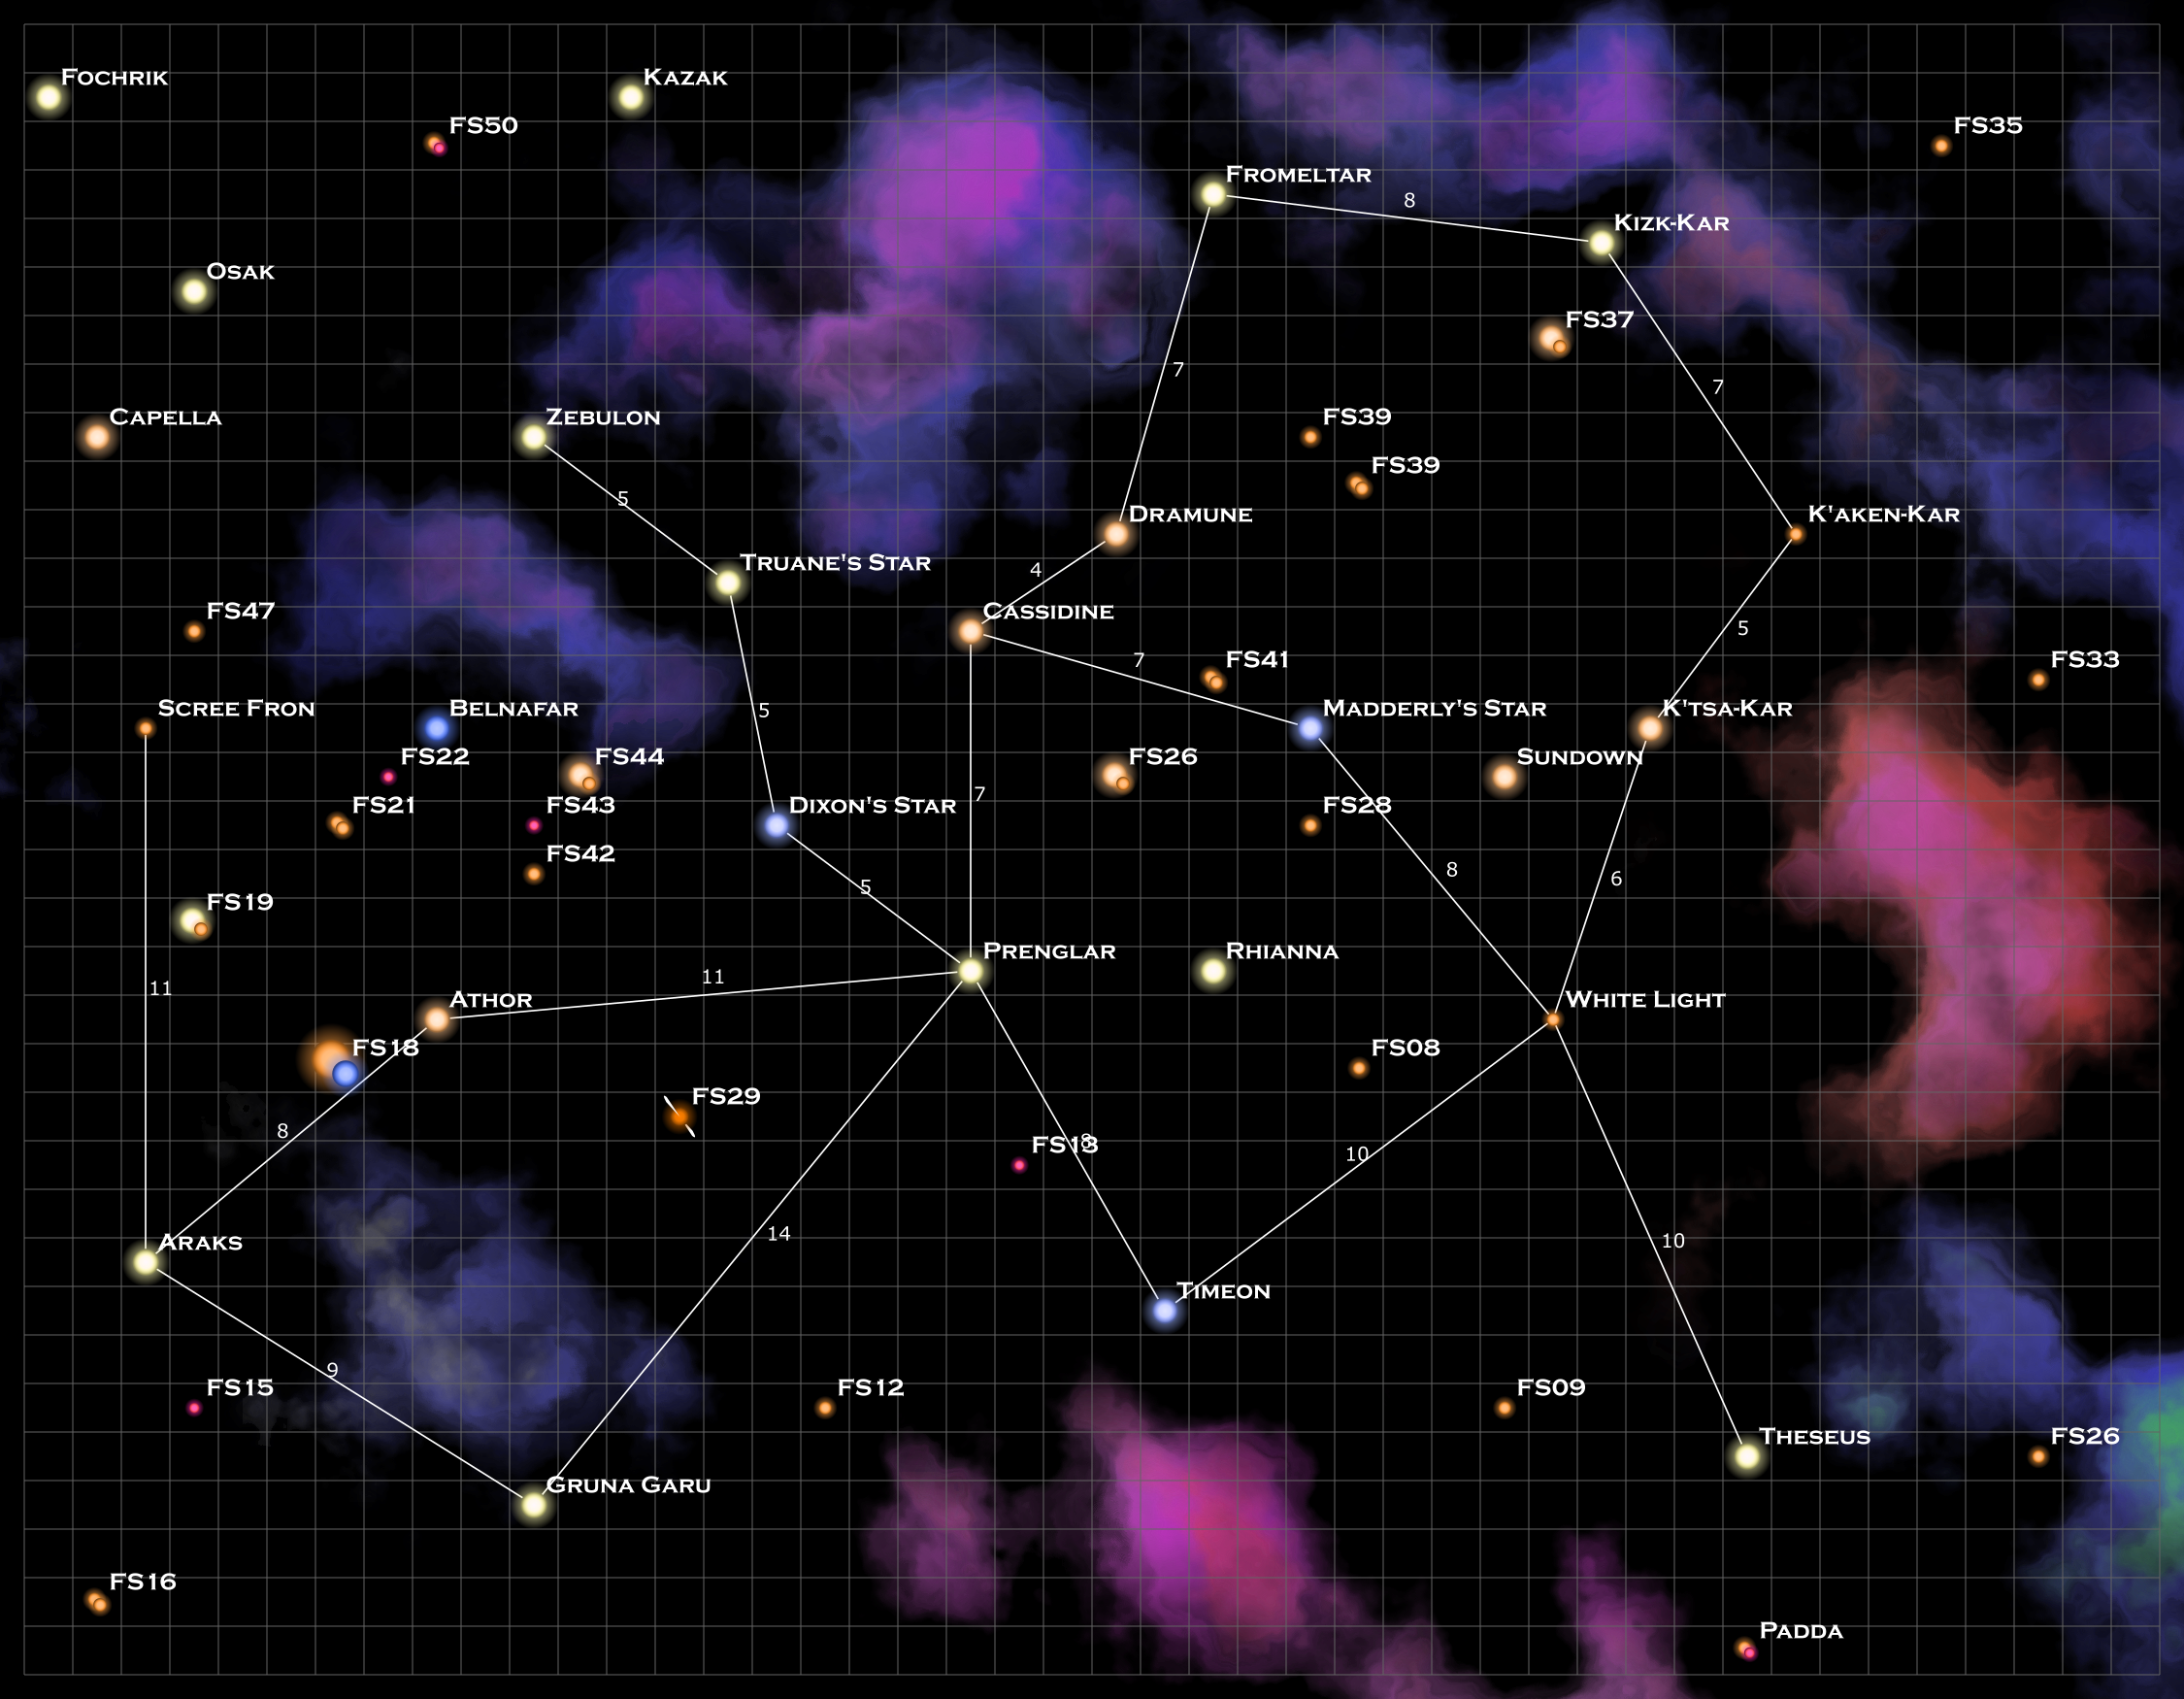
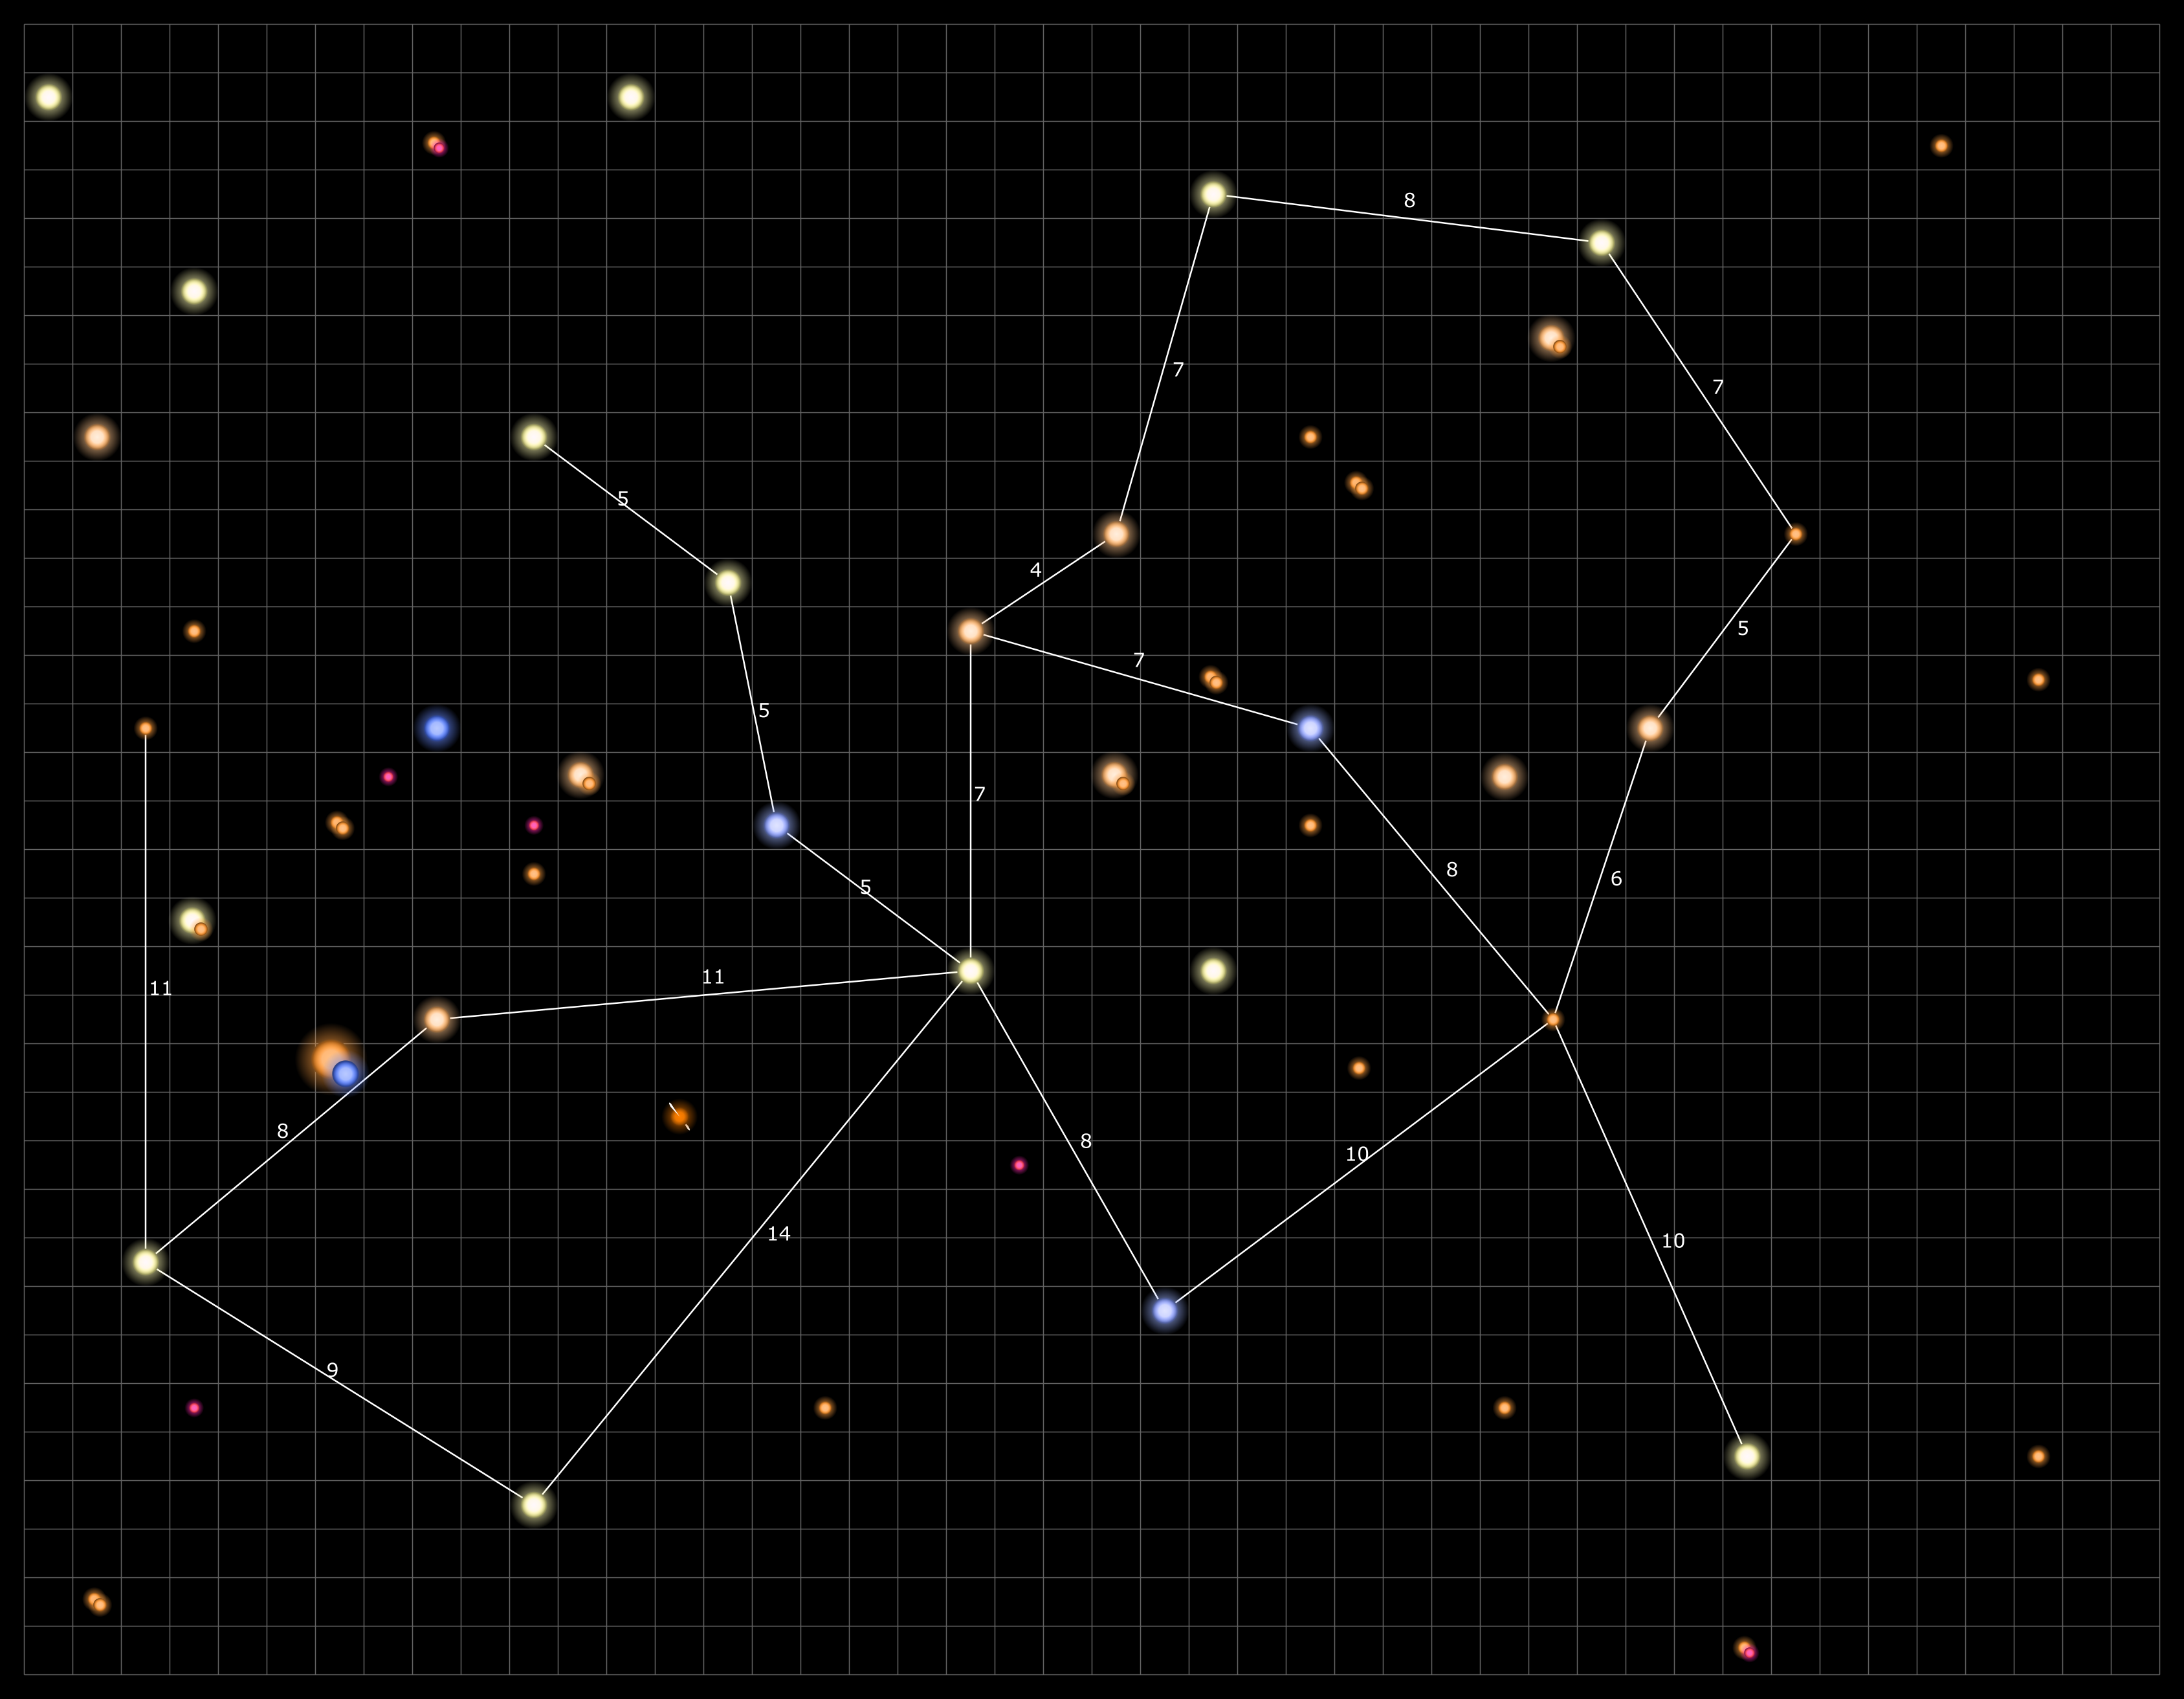
Let’s start by showing the map. And then we can talk about how it was made.

Click for full sized version (~8MB)

So to make the color version of the map, I simply ran the program a few times, tweaking the density parameter to generate exactly 129 systems. They weren’t in the right places yet, but now I had all the data I needed, I just needed to update the positions. If I had already assigned the system characteristics back when I rolled them by hand, I might have actually just entered all that data. However, since I didn’t, and I was using the same random tables (with some additional refinements), I went with the new data.

The next step was to update all the positions. This is actually what took the bulk of the time as I had to manually edit each entry to match a position on my hand drawn map. And then somewhere (at about x=26) I messed up and suddenly dropped back to 24 and everything was off and I had to work back through the numbers and find where I messed up.

As I was working through the positions, there were four stars that I knew the general characteristics of: Rael, Proxima, and two systems from the sequel novel. I made sure that systems that matched the expected parameters for those systems ended up in the correct positions. In the case of Rael, there was no G2 star in the data set so I changed one of the other stars (I think an F9) to be the needed spectral type.

The Third Dimension

The feature that this map adds that I didn’t have in the Frontier map is that the stars all have a z-component to their position, a distance above or below the plane of the map. Since you can’t easily represent that by position on a flat map, what the program does is write the z-component as a small value to the lower right of the star symbols.

Example of some systems with their z-coordinate included.

This required a small change to the code to implement. The original version of the code did draw the z-coordinate, and in developing the code for the Frontier map, I had added a parameter to turn the printing on and off. Since I had it off for the Frontier Map development, I hadn’t kept that bit of code completely up to date.

However, it didn’t take much. Mainly, I needed to increase the font size as I realized that it was just a bit too small to easily read unless you were really zoomed in on the map. And that change also entailed moving the positioning of the text just a bit as well. The code now includes a scale parameter that adjusts the text and star symbol size that I added while making the Frontier map. I elected to not have the font size of the z-coordinate scale with the other aspects of the image. It’s fine to stay small if you increase the scale.

Two systems in the same (x,y) position. In this case a G star (RS075) and a binary pair of M stars (RS074). These systems are actually 10 light years apart.

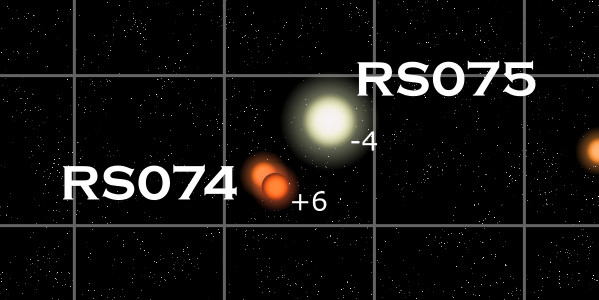
Another aspect of adding in the third dimension is that is is possible to get more than one star system in the same (x,y) position, but separated in the z direction. That actually happened at five different positions in this map. When that happens, the code automatically shifts the stars away from the center of the square where it would normally draw a single system. While it possible to have more than two systems in a single (x,y) grid position, and the program can handle up to four, I’ve never had more than two in any map I’ve examined.

A Word on Names

There are only two named systems on this map, Rael, the home system of the stories, and Proxima, the other star system visited in the first book. In truth, most of the stars probably have names, especially the brighter ones as they can be easily seen from the night skies of Jord, the habitable planet in the Rael system. I just haven’t sat down and figured out what they are yet.

All the other systems, for the purposes of this map, just received RS (Rael Sector) designations. Those were assigned by starting in the upper left and running vertically numbering the systems moving to the right after each column.

Jumps and Nebulae

That was about it for the automated processing. The only other bit was the single jump between Rael and Proxima. It’s a short 5 lightyear jump and the only one that exists at the end of the first book, which is where this map is set.

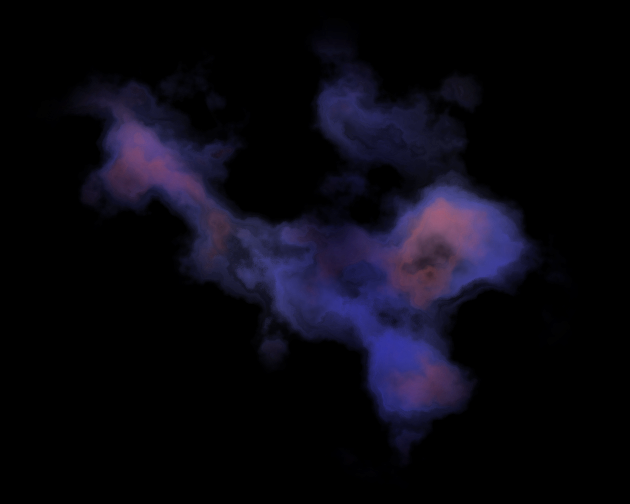
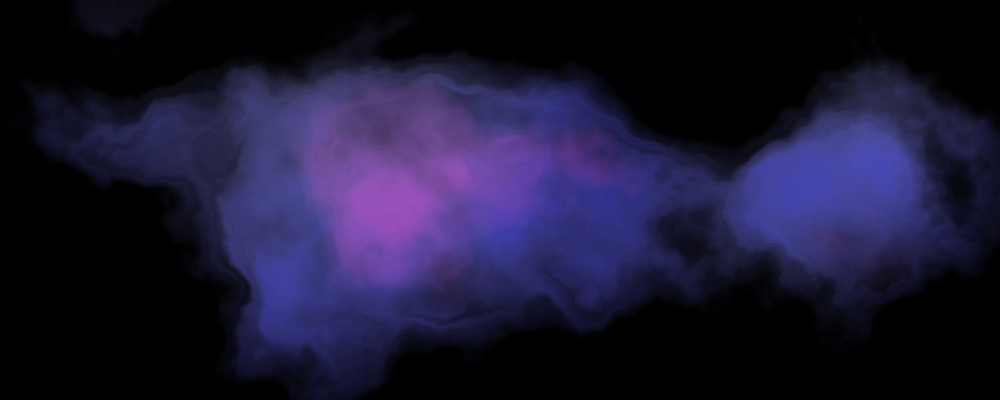
Next I had to decide if I wanted to add in nebula or not. In this small region of space, with the older stars, there probably wouldn’t actually be any large nebula. But they sure make the maps look a lot nicer. So I decided to add two large ones in. I created these just like the ones I did for the Frontier map although I muted their colors significantly.

You might notice that some of the star systems look like they are in the middle of the large nebula. However, if you look closely, all those systems have a high z position. They are near the top of the map sector. Thus the nebula is actually below them on the map. That is true for both of the large nebula, they are at the bottom of the 3D volume.

There were also some solitary white dwarfs in the sector (and several more that were in binary systems). Since white dwarfs form from the death of stars like our Sun, and those deaths usually involve the creation of planetary nebula, I decided to add in small nebula around those two stars as well. You can see them over on the left side of the map, a little above center. For those nebulae, I simply grabbed a couple of planetary nebula images from NASA ,then scaled and rotated them to fit the map. They are roughly to scale as planetary nebula are typically about one lightyear across and that’s the size of one square on the map. It’s left as an exercise to the reader to figure out which nebulae I used, although it shouldn’t be too hard.

Final Tweaks

The last thing to do was clean up all the names. By default, the program just prints them up and to the right of the star symbols for the system. The ones on the far right fell off the map. The ones in the five locations where there were to systems in the same square were writing on top of the star systems. And some of the nearby systems were overlapping as well. Plus I wanted to move Proxima’s name off of the jump route line. These tweaks were all done by hand.

I also added in the map title in the upper right and the attribution in the lower right. And with that, the map was done. All told, it took about four hours to make the map, most of that being spent entering the positions.

Code Todos

As always, when I work on this, I dream up more things I’d like to code to do automatically.

In this case, it is to be more intelligent about where it places the system names. Especially in the case of multiple systems in the same grid. I’d still probably have to end up tweaking things manually in the end, however, so it may not be worth the effort.

Using the Map in Your Game

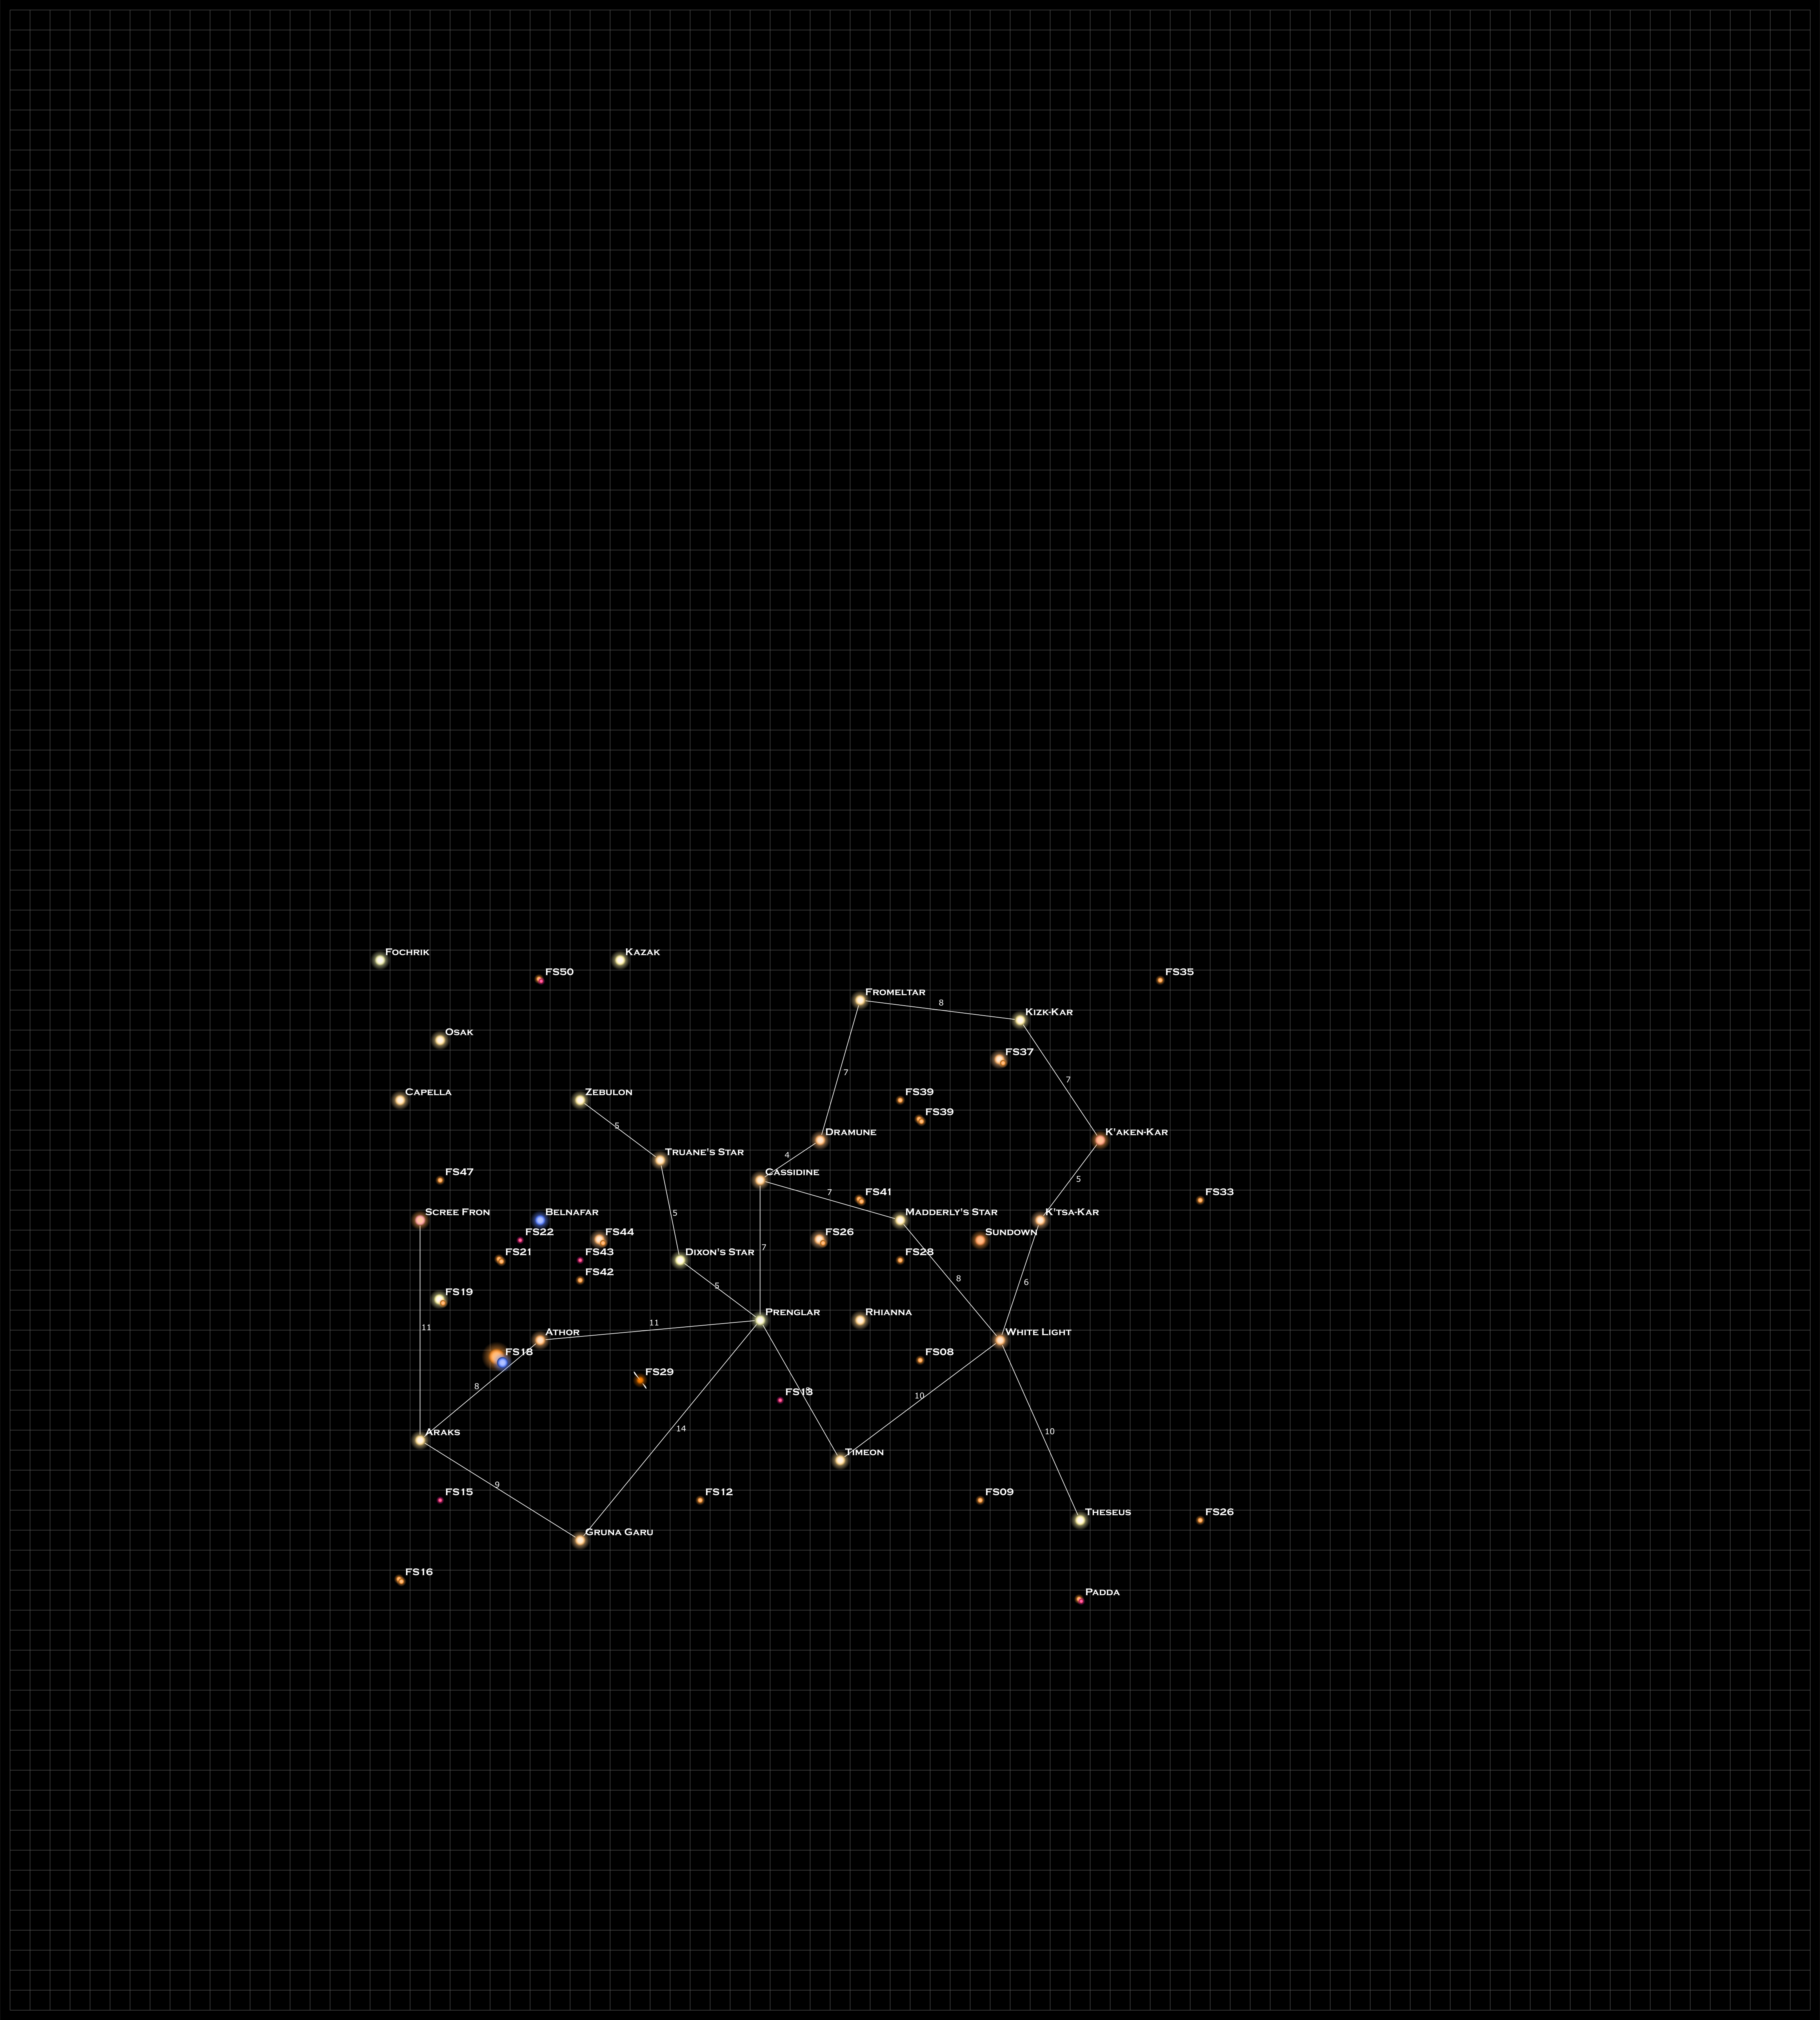
On the the purpose of this blog is to develop and create resources that you can use in your sci-fi game. And if it weren’t for the names on Rael and Proxima, this would just be a generic sector map that you could drop in anywhere. So, to that end, here’s version of the map with the names filed off:

click for full sized version (~8MB)

The other thing you’ll probably want is the actual data used to make the map. That will give you the spectral types for each of the systems. That can be found in the file below, which is an input file to the program if you want to use it.

Sector001DataDownload

Last Thoughts

And that’s it. Do you find these maps, especially with the stellar data added, useful. Would you like to see more of them in the future.

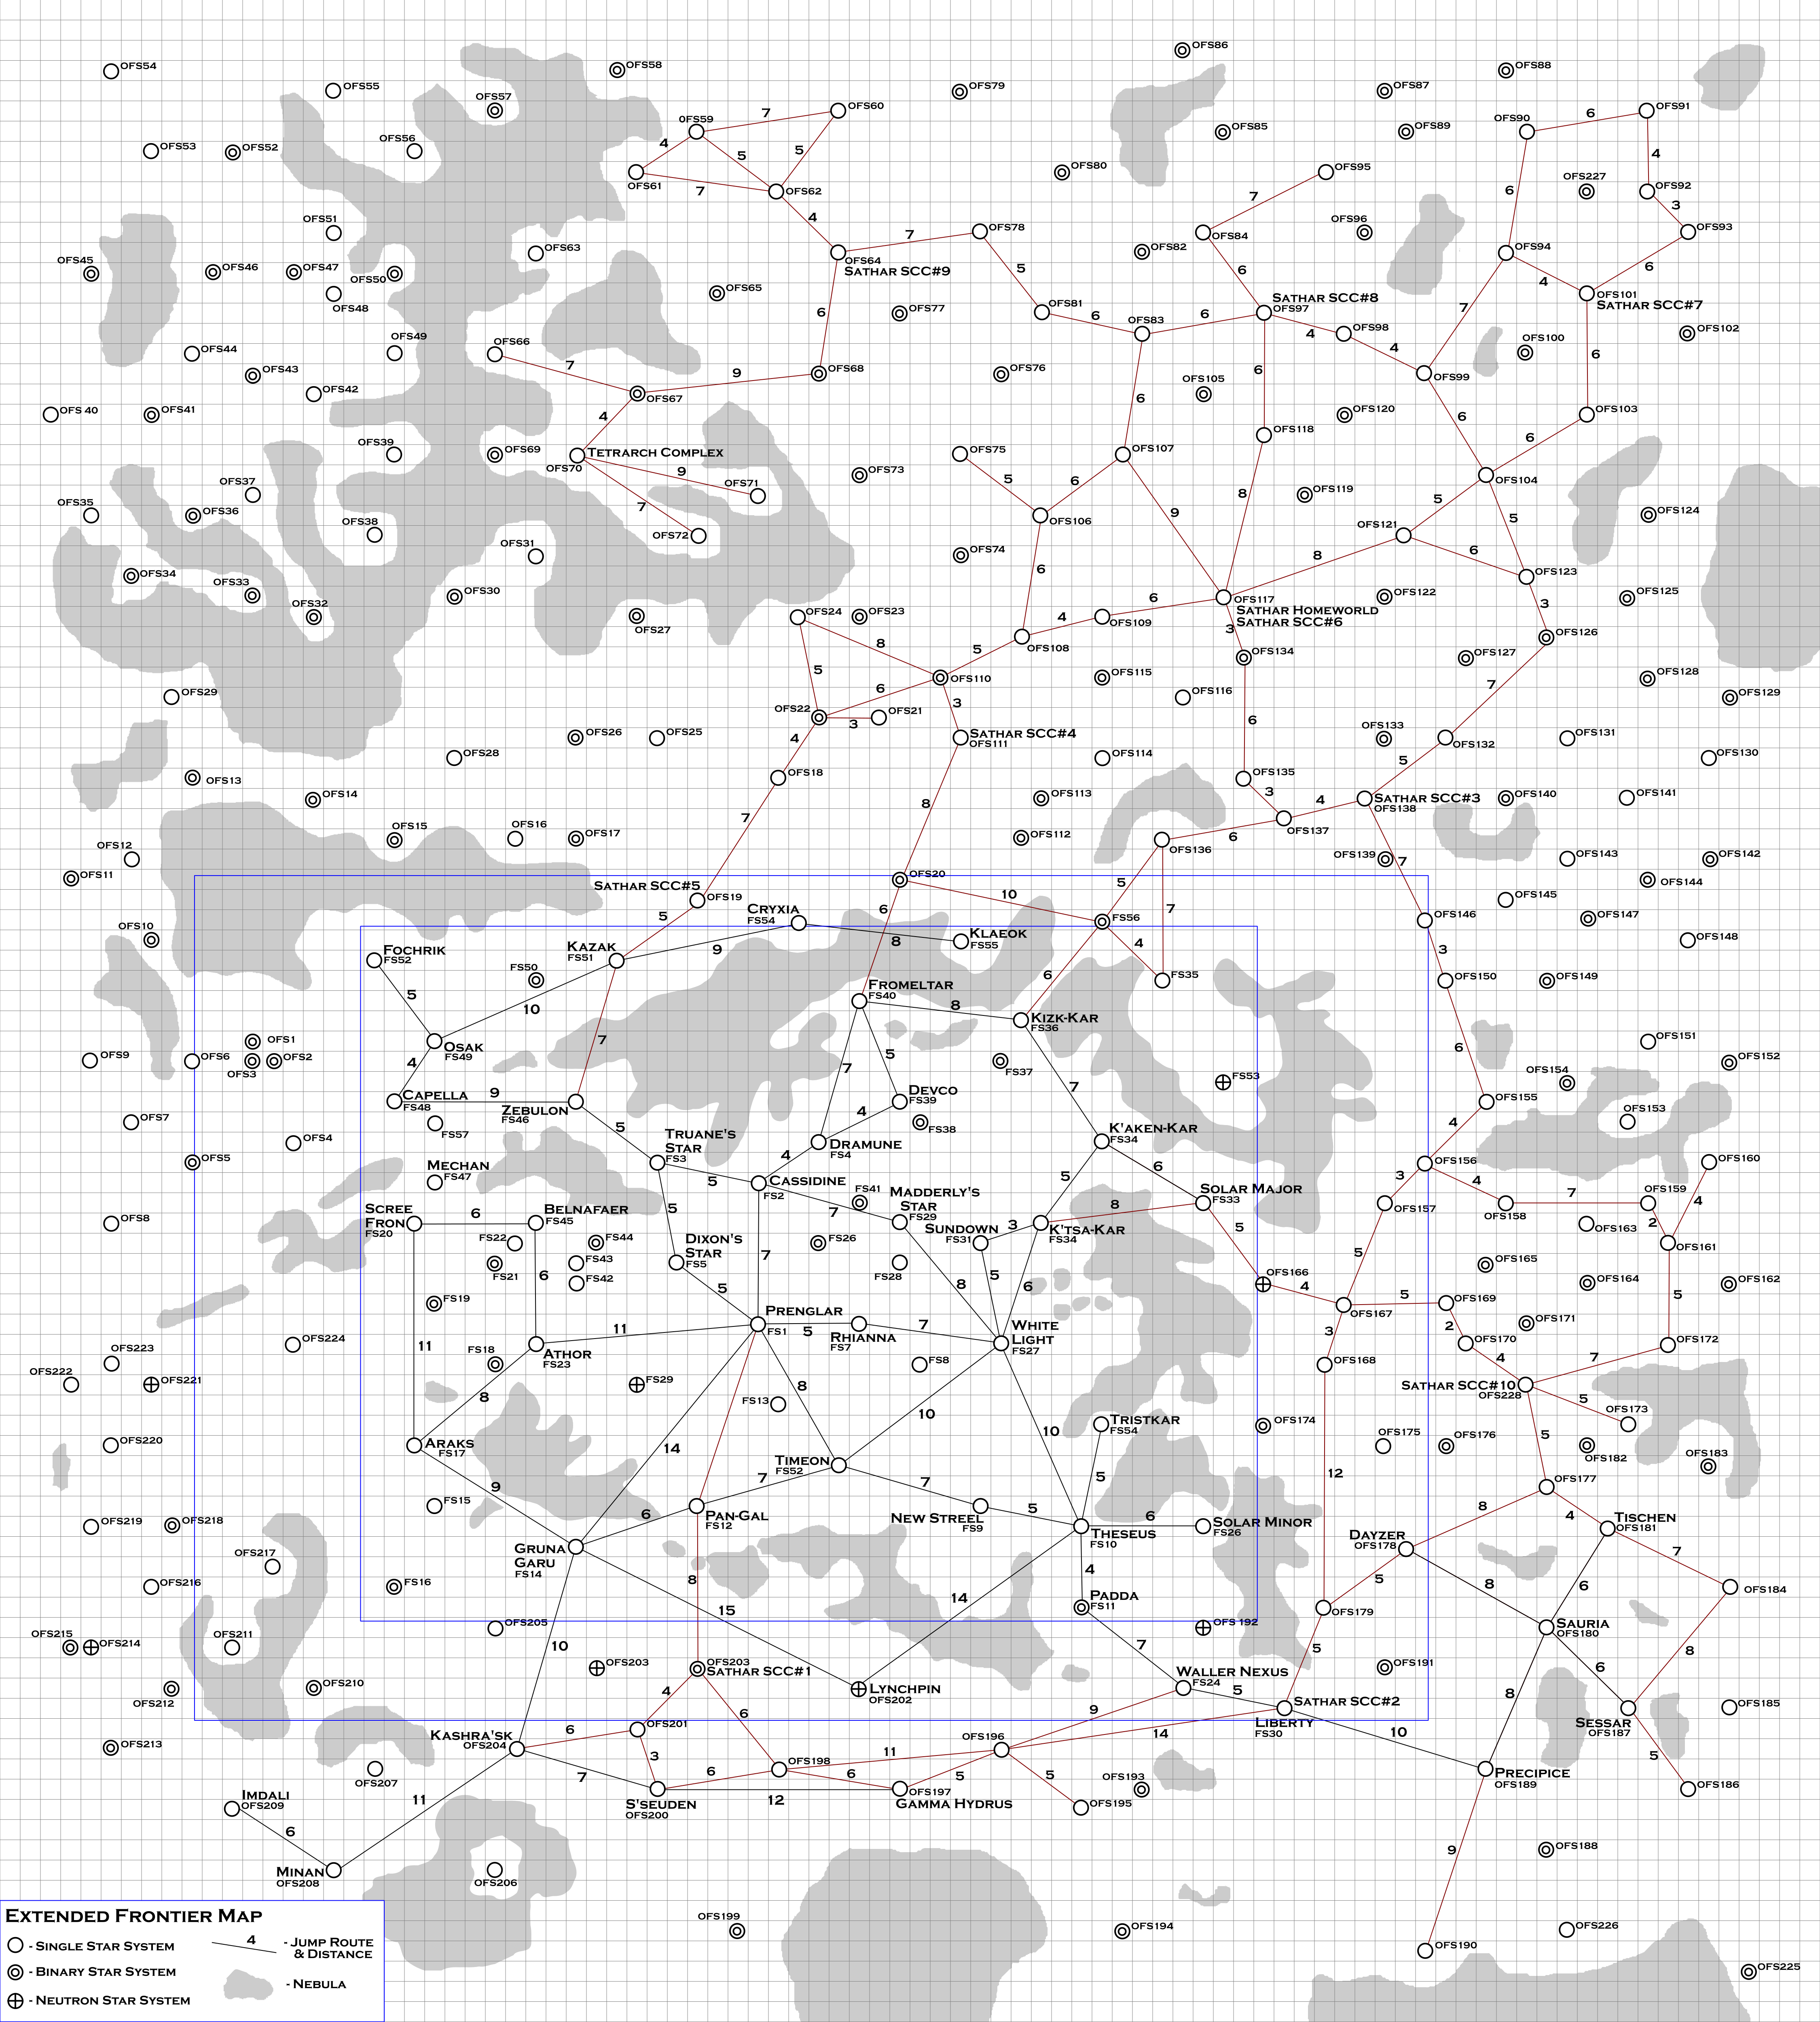
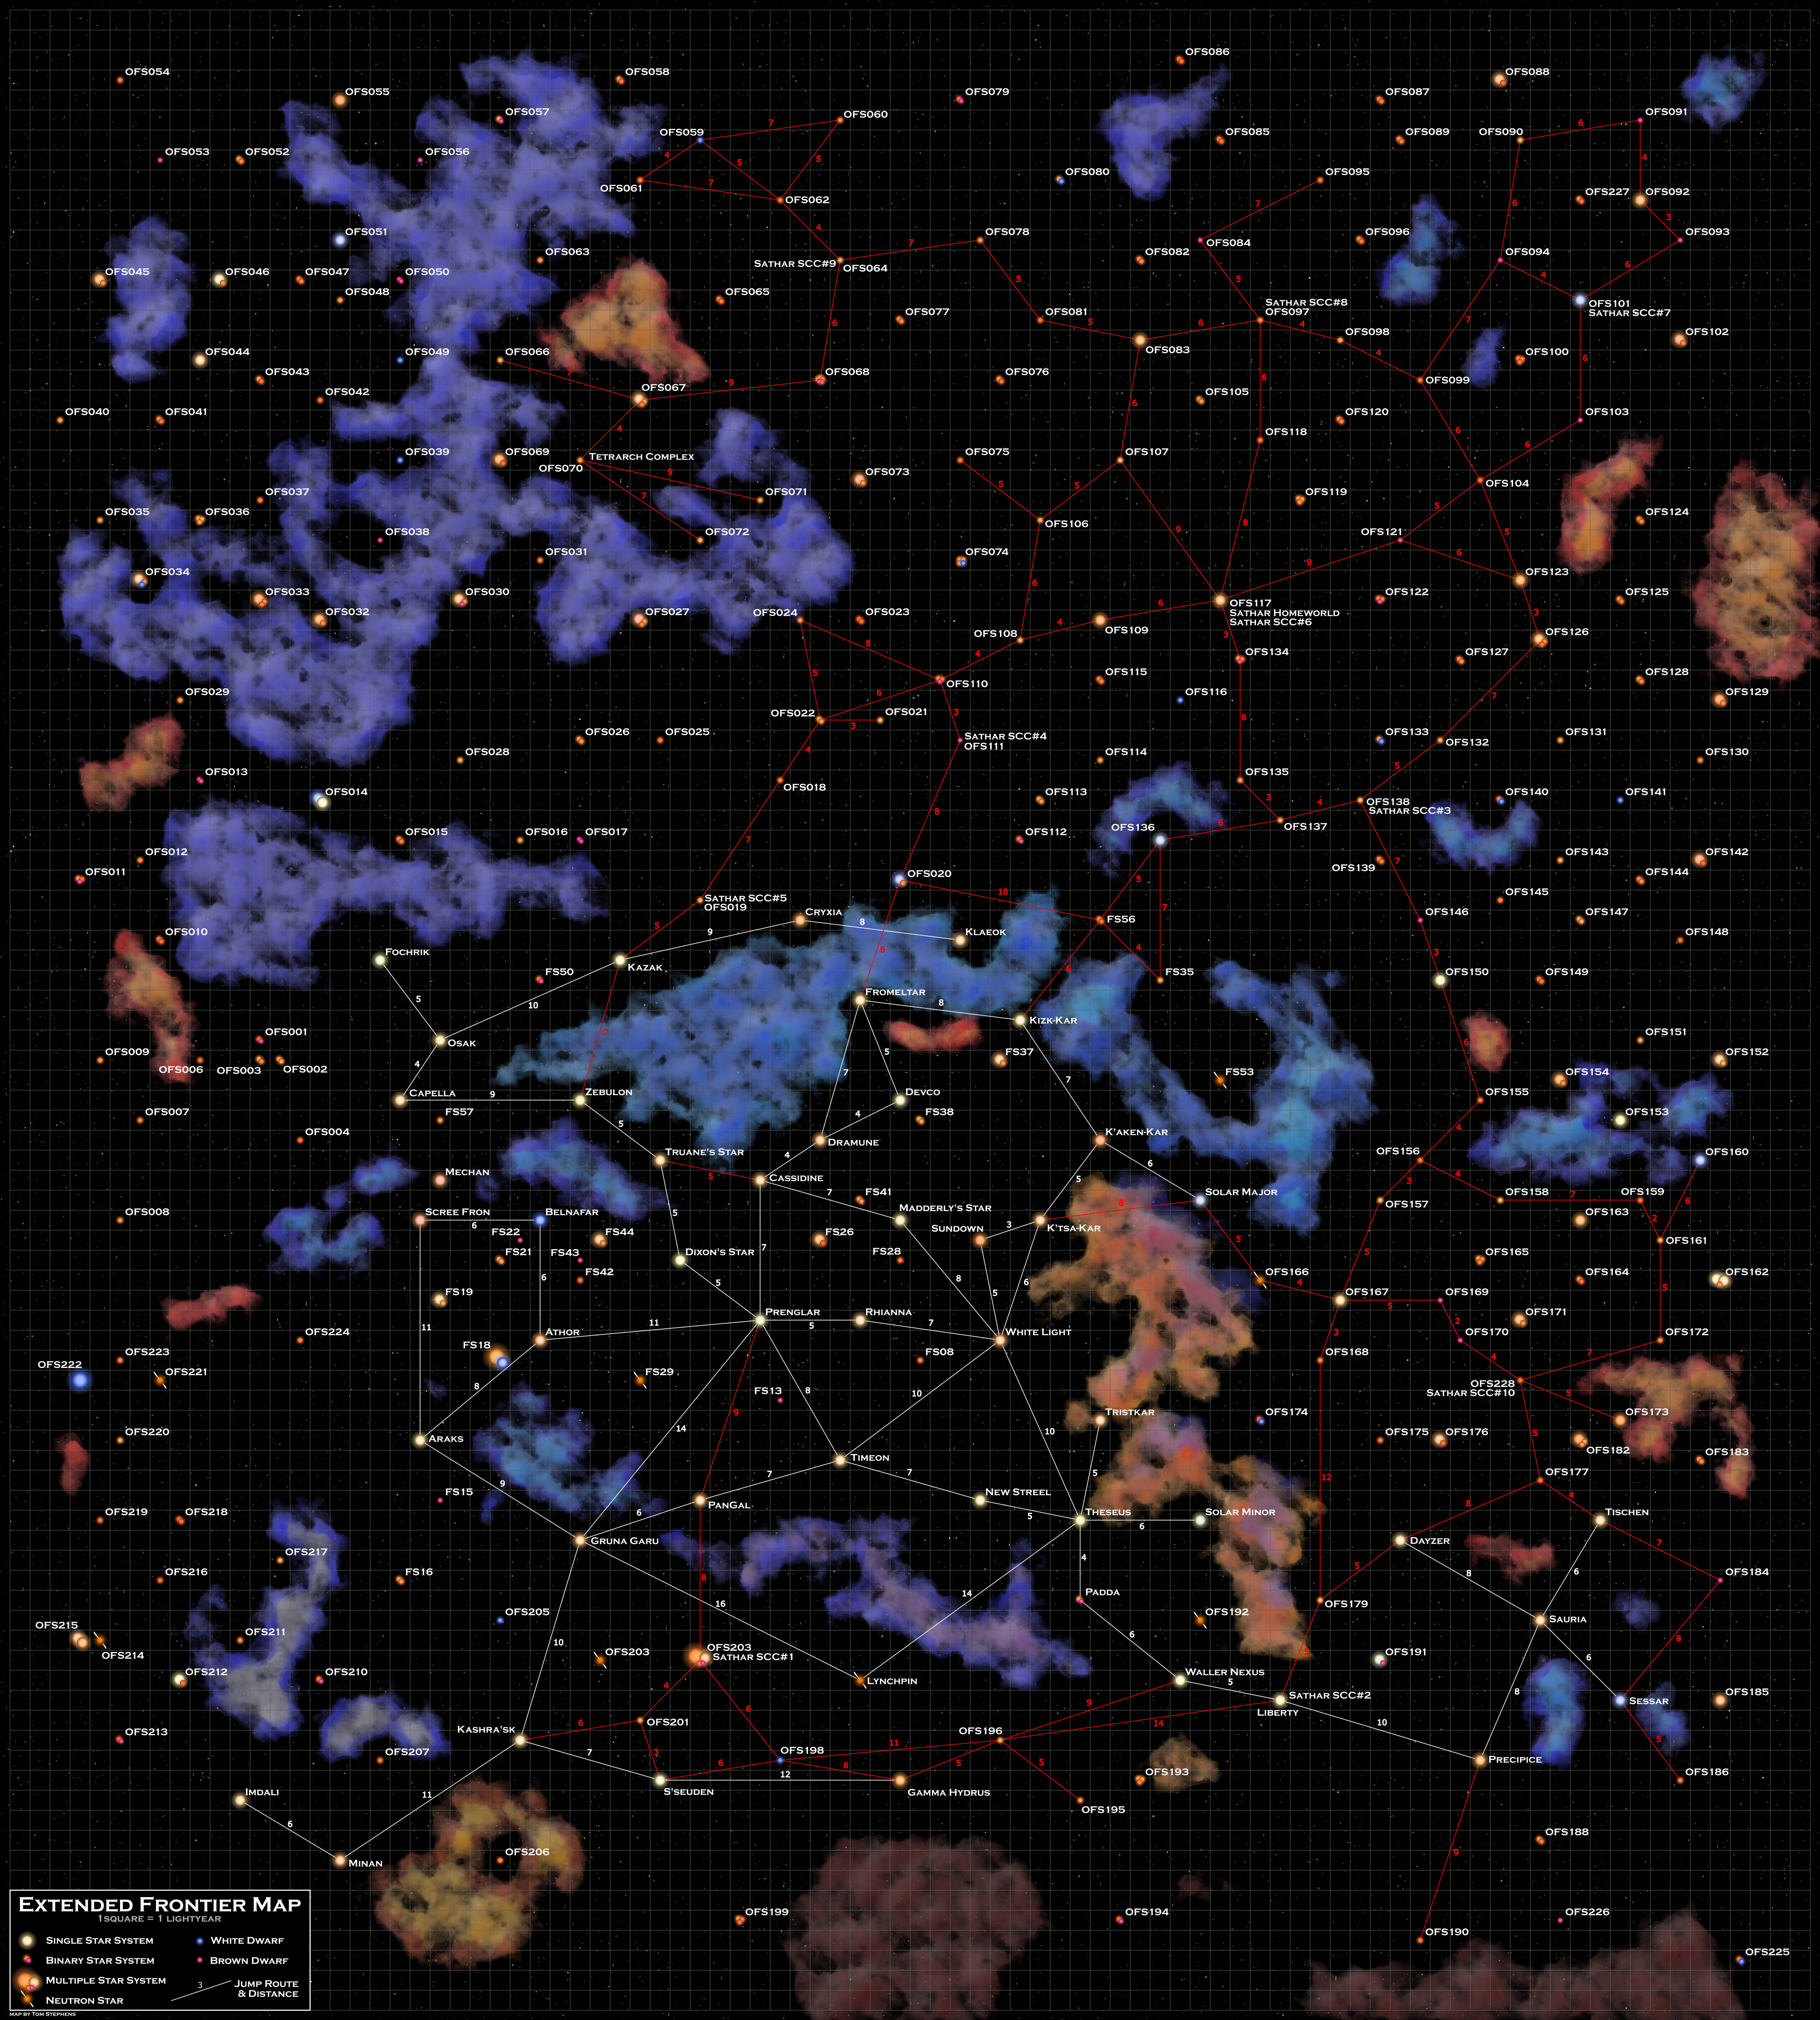
Also, if you want a printed copy of the Extended Frontier Map, I’m still taking pre-orders through the end of August.

August 20, 2019 Tom Leave a comment

Printed Copies of the Expanded Frontier Map

There was enough interest in getting printed physical copies of the map that I’ve set up an ordering page for them. You can follow the link to get there or hit the “Order a Map” tab at the top of the page.

You can get the Player version, Referee version, or both. Price is $20 a map (including shipping) in the US and $40 international, with a discount if you order one of each. All the details are on the ordering page.

I’ll be taking pre-orders through the end of August 2019 at which point I’ll actually get the posters printed. Any posters ordered in this first round will be signed and numbered. If you want a copy, jump on over and get your order in.

August 2, 2019 Tom Leave a comment

Extended Frontier Map – final update – Referee’s Map

Okay, I had planned to do a different post this week as part of this month’s RPG blog carnival but that will have to wait. I decided instead to just push through and finish the Expanded Frontier Map instead.

Corrections

If you downloaded the color player’s map from last week’s post, go back and do it again. As I was working on the final map, I found a bunch of mistakes that I completely missed while working on last week’s map. Most of them are minor, like names overlapping jump lines, but a few of them are pretty bad like names overlapping each other or running over jump distances. In any case, I’ve fixed those and uploaded new maps to the links in that article.

Adding the Sathar

The only difference between this map and the previous one is that I’ve added in all the jump routes known by the sathar as well as some labels on the map that give the location of the sathar homeworld, their ten starship construction centers, and the location of their Tetrarch ruins complex similar to the one on Laco (If you are following the timeline posts, this is where the signal went out to and was returned from). I haven’t defined which of these systems are actually inhabited by sathar, I’m leaving that up to the individual referee to decide.

Let’s start by showing the black and white version of the map and then I’ll talk about how I filled it in.

Extended Frontier map containing all the sathar jump routes and system labels.
Sathar jump routes are shown in red. Click for full scale version.

Jump Routes

As you can see, most of the sathar systems are up and to the right of the Frontier. This is the their main population center. The tendrils that surround the Frontier tend to be more outposts and travel lanes than population centers.

In addition to the jump routes marked in red, it is assumed that the sathar know all the UPF routes marked in black as well.

The routes don’t extend to the left side of the map as the sathar stopped their expansion in that direction after encountering the Rim. They were also stopped by that big nebula in the upper left. I have plans for some of the star systems up in that area on the far side of the nebula.

I consider the jump routes along the bottom of the map, from Saurian space, past Liberty, into S’esseu space, and then up to Prenglar to be newly explored routes. In fact, in the current version of my background material, the starship construction center just south of PanGal, labeled SCC#1, is still under construction and hasn’t even started producing ships yet in my timeline project.

When I first made this map back in the 80’s, I didn’t have Zeb’s Guide and obviously none of the fan material existed so this region of space looked a little different on my original map (I should probably scan that in and post it for reference). But the idea was that these routes were established to give the sathar the jump route right into Prenglar in the Second Sathar War game in the Knight Hawks Campaign book allowing them to strike at the heart of the Frontier. In creating this map, I modified my original concept to work through these modified regions of space. It also provides an opportunity for interdiction as the UPF could potentially cut off some of the Sathar routes.

Starship Construction Centers

The numbering on the starship construction centers may seem a little odd and requires a little bit of explanation. I originally built this map for two purposes. The first was to give me a more strategic level view to write a Second Sathar War timeline, taking into account sathar ship production as well as the UPF ship production. I wanted to see how the balance of forces would work if you stuck to the rules on ship construction. This is now being realized in my timeline project.

The other was to provide a larger Frontier region for a big exploration campaign inspired by the Beyond the Frontier series of adventures (SFKH 2-4) where the PCs would explore out from Truane’s Star upward on the map. I have had the beginnings of that campaign in a notebook for literally decades. Maybe it’s time to dust it off and use it for material here on the blog.

It’s the former purpose that resulted in the numbering of the starship construction centers. I originally had the ones labeled 1-5 dedicated to the Second Sathar War effort. They were strictly producing military vessels with which the sathar would be attacking the Frontier. And I just started at the one connected to the Prenglar jump route and numbered them counter-clockwise.

SCCs number 6-9 were added in to provide “civilian” ship construction for the sathar population and exploration away from the Frontier. They are not labeled on my original map but were added in as part of this project. The final SCC, #10, was added as part of my timeline project to provide the production capacity for the Sathar offensive against the Saurians. I’ll probably do another post about the production capabilities of all these construction centers at some point in the future.

The Sathar Homeworld

The sathar homeworld is labeld on my original map. I had always envisioned it as a slightly cooler star than the sun with their home planet close relatively close in and warm and muggy. As such, I’ve given it a K4 spectral type on the map. Someday I might actually design and write up the system.

The Final Color Map

Now that we have the background information covered and everything else in place, it was time to make the final color version of the map.

This was done in two steps. First, I made a separate data file that had all the star systems again but instead of the jump routes known to the UPF, it contained the jump routes known only to the sathar. Using this, I generated a new map.

Since the map is generated with the jump routes on different layers, the second step was to just open the new map, and copy everything off the jumps route layer, open the Player’s map, create a new layer for the sathar jumps, and paste them in. I then had to adjust the position of all the features after pasting them in but that was just a matter of looking up the position in the original image and entering that in to the final image.

Of course, it really wasn’t that simple. The last step in adding the jumps was to adjust the color. The program makes all jumps in white. I simply changed the color to red in the final map. But that does give me an idea for an enhancement in the program, namely allowing the user to specify the link color.

The next step was to add the sathar specific labels. To do this I created a second names layer that I could add in the labels for the sathar homeworld, the starship construction centers, and the Tetrarch complex. Since the sathar jumps and labels are on separate layers, I can turn them on and off as need to make a player or referee version of the map as needed.

The final step was simply clean up. I went through the entire map and moved star labels and jump route distance labels in order to have the map as clean and clear as possible and fix and small issues the program has in drawing the labels. This is where I discovered the errors in the original version of the Player’s map and fixed them. And since the sathar names and jumps were on separate levels in the image, it was easy to re-export that map.

And that was it. The map is now done. (Unless I find some more typos as I start using it.) Here it is in all it’s glory.

The sathar jump routes don’t quite show up at the resolution of this preview. Click for the full sized version (~4.5 MB). There is also a very high resolution version (~20 MB) available.

The Code

Again, if you want to play with the code and make your own maps, it is written in Python and you can grab it from my GitHub repository. I’m going to continue to work on this code. This will be to add in the remaining features it’s lacking to make it more user friendly such as command-line options, the jump route colors, and creation of nebula, but those will fall under a different article title going forward. If I get really ambitious, I might even add in a GUI to make it a windowed program instead of a command line one. We’ll see. I’m curious how much interest there would be in that project.

Final Thoughts

This has been a fun project. I’ve really enjoyed doing it. As you can probably tell by the number of posts I’ve made. And I love the look of the final map. If you see any errors, feel free to let me know and I can update the map to correct them.

I think if I was doing this again, I would make the map dimensions a little different. This map was original made by taping together six sheets of graph paper (landscape orientation). while that ended up with a nearly square work area, it wasn’t quite. The map is 90 ly wide by 100 ly tall. If I were to do it again, I’d make it either perfectly square, or conform to a more standard aspect ratio.

I’m also curious if anyone would be interested in a printed, poster sized version of the map. 24×27 inches. This is actually what prompted my thoughts on the dimensions. As a purely digital product, the aspect ratio doesn’t matter. But when you try to print it, you start to run into problems. I’ve been looking at possible printing options, and while most of them want you to use a standard aspect ratio (16×24, 24×36, 12×18, or square), I have found a few that would let me print it to exact size. Final costs would be in the $15-$25 dollar range for the 24×27 inch one. If that is something that would interest you, let me know in the comments. I might do this as a small Kickstarter for those that are interested.

And that wraps up the the Extended Frontier Map project. Let me know your thoughts, ideas, and any remaining questions you have about the project and let me know if you’d like to see more things like this in the future.

July 16, 2019 Tom 5 Comments

Expanded Frontier Map – update 5 – The Player Map

Woo-hoo, we’re approaching the end of this particular project. In this update we present the final* “Player” version of the Expanded Frontier Map, both the color and black and white versions. This version just contains the systems and jump routes known by the UPF as presented in the rules, modules, and some fan content.

(* Final assuming I don’t find any typos and such)

Changes

First up, as I was generating the data for the color version of the map, I realized that there were just way too many neutron stars on the map. There’s one on the original AD map, five on the Zeb’s Guide map, and I had added in a couple dozen or so more.

One is too many for this volume of space. You might find one (anything is possible) but beyond that is really stretching it. However, since the five are in the original materials, I left them in. I also left in two of the ones I added in the lower left of the map. This puts all the neutron stars in the Frontier region and towards the Vast Expanse. Maybe there’s an explanation for that.

For all the other neutron stars, I replaced them with multiple star systems. That changed two dozen stars systems from neutron stars to multiple star systems, some with as many as five stars.

In comments on the previous update, it was pointed out that I forgot to label Mechan, the world in Zeb’s Guide where the Mechanons fled to when they left Volturnus in the Zeb’s Guide timeline. I don’t typically include that event in my games which is why I probably forgot to include it. Mechan is just up and to the right of Scree Fron on the map. That just required changing the label.

In fixing the labeling on Mechan, I also noticed that the Zeb’s Guide map adds another star 3 light years above Mechan near Capella. So I added a star in there as well.

As far as I can tell, that fixes everything.

The Black and White Version

So that gives us the new and updated black and white version of the map.

The Color Version

Creating the color version was mostly a matter a generating a large number of random systems and then positioning them on the map. Since I had to manually update all the positions, that took a couple hours of work to get all the data into the file and the coordinates updated.

After that, I could generate the rough map with my mapping software. The next step was to go through by hand and tweak the position all the labels that needed to be moved. There actually weren’t that many, I just had to move a few names and a few of the jump distances so that they were not overlapping any of the jump route lines. That cleaned up in just a few minutes.

The other major portion of the map was creating all the nebula. Since I had the outlines of them on the black and white map. I just copied (and scaled) those outlines to the color map. In a few places where the B&W map has little wisps of nebula next to the big ones, I connected them as the process I use to create the nebula would make those wisp-like areas.

This actually took less time than I was expecting. Since I was working zoomed out on the map, the rendering went fairly quickly. Whenever I zoomed in, however, it would take some time to redraw the screen due to all the detail in the nebula. From the earlier sample map, which was zoomed in, I had experienced a bunch of slow down and was expecting the same here. I thought I was going to have to do the nebula on a series of layers so that I could turn them off and on. That wasn’t actually necessary and this process only took a couple of hours instead of the several hours I was expecting.

The hardest part for me was picking colors. The truth is that there probably wouldn’t be any nebula in this part of space but since they look cool and were included in the original material, they are part of the map. I tried to pick colors for them based on the stars that were around as most of the nebula would be reflection nebula since none of the stars in the area put out that much ionizing radiation to cause the gas to glow on its own. I’m not completely happy with it but I like it. This is something that might get revisited at some future date.

The next step was adding in a legend. This also might get redone in the future to include each of the different stellar colors but it is good enough for now.

Finally, I decided I didn’t like the flat black background but wanted there to be a bunch of faint “distant” stars speckling the background of the image. To get that effect was pretty simple. I just applied the Textures->Cracked Glass filter to the black background layer. I’ll admit that I got lucky here and it applied the exactl level of background noise that I wanted. There are other filter combinations that would work as well but that was good for now.

With that done, I signed it and exported the final image.

This is a scaled down image. Clicking on the image above downloads the medium resolution one which is the same scale as the black and white map (4 MB) There is also a full, super high-res version (18 MB).

Up Next

The next step is to do the Sathar worlds and jump routes. Since all the stars are there, all I need to do is add in the links and update some labels. That will be the topic of the next and final (at least for a while) update.

Share you questions, comments, and impressions in the comment are below.

July 9, 2019 Tom 1 Comment

Expanded Frontier Map – update 4

Okay. I’ll admit that this project has taken over my brain. It’s been fun for me to work on it and dust off some of my programming skills. This will be another small update as I haven’t had a lot of free time this past week but enough to get some work done. If you haven’t read them yet, the early posts are here: original post, update 1, update 2, & update 3

The good news is that I think there will just be two more updates and we’ll have the completed map. There might be a few more after that for upgrades to the software but those will probably be a bit more spaced out. Here’s what’s left to do:

  • Random generation of spectral types (this post)
  • Complete “Alpha Dawn” map (this post)
  • Complete “Player’s Version” of the Extended Frontier map (update 5) – This is the full color version of the B&W map I’ve been posting
  • Complete “Referee’s Version” of the Extended Frontier map (update 6) – This will be a version of the map with all the Sathar system labels and jump routes included.

I’ve decided that to get to the completed map, I’ll just do the nebulae by hand. I already have the shapes drawn on the B&W version of the map so it’s easy enough to transfer them and do the render. Getting the software to do the nebulae will be a future project.

If there is interest, I could also do a remake of the Zebulon’s Guide to Frontier Space version of the Frontier map in this style. While I’ve modified my map to match most of the named systems on the Zeb’s Guide map, they are not exactly the same (for reasons discussed in earlier posts) and the unexplored stars do no match between the two maps. If there is a large clambering for it, I’ll do that as a future project.

Let’s get on with this week’s update:

Random Stellar Types

After I had the program interpolating the colors between the base spectral types, the next step was to sit down and code up the random generation of those spectral sub-types. I needed this to randomly fill in all the “unexplored” systems with a proper mix of spectral types. The explored systems are way too heavily weighted toward the F & G stars and there are a few too many (i.e more than about 3) for the number of stars in the region but that’s okay.

In any case, I wanted the relative numbers to be approximately correct based on real stellar distributions so I busted out data on the stellar mass functions and after a bit of math came up with a d100 table for the various main sequence spectral types (A, B, G, etc.) to determine the relative ratio of their sub-types (A0, A2, A4, etc). Once I had the numbers it was a simple matter to code up a few subroutines to generate the values. There are some refinements I could make in the future but this is good enough for now.

Complete “Alpha Dawn” Map

Once the program was generating random spectral types in the correct distribution, it was time to finish the smaller map corresponding to the Frontier provided in the original printing of the game and the later “Alpha Dawn” reprint (named to distinguish the core rules from the Knight Hawks supplement).

I did this by running a random map and then taking the spectral types generated and applied them to the remaining systems in the original map. Next I took the resulting file and edited it to tweak the positioning of some of the labels so that they weren’t overlapping any of the jump lines or other text. Finally, I took the nebulae I had created for the earlier version and imported them into this map. This gave me my final version of the smaller map.

The full version of this image is 2250×1750 px (1.8 MB). You can grab an even higher resolution version (6750×5250, 9MB) if you want.

I might revisit this in the future and do the nebula with different colors but for all intents and purposes, this one is done.

In making this I realized that the stars in system FS18 are really bright. It’s an M0 Giant and A0 main sequence star in a binary system. Combined, they are ~39x brighter than the sun and only 2 ly from Athor. That means they would appear to be at -5.27 magnitude star in the night sky. For reference, the brightest star in our sky, Sirius, is only -1.46 (small, more negative numbers are brighter). Venus, at its brightest, is a -4.2 magnitude object. That means that this star appears 2.5 times brighter than Venus at it’s brightest and about 30 times brighter than Sirius.

The Full Map

Now that the AD map is done, it’s time to start working on the full Extended Frontier map. I knew I was going to need a lot of random star systems so I generated a big random map with the program to get a good number of star systems with the correct spectral type distribution. I’ll use this whenever I need a random system value.

That done, the first step was to get the data for all the various labeled systems on the map. I already had the ones from the AD map I just needed to add the others. The data for these systems came from a variety of places. For the systems included on the Zeb’s Guide map, I used the spectral types listed in Zeb’s Guide after verifying that they made sense when mentioned in the modules (which usually just gave a color). I didn’t find any real issues so I just used the Zeb’s Guide values.

For the Saurian systems (east of the Frontier), the spectral types were taken from the article “The Sauria Sector” published in the Frontier Explorer, issue 4.

The data for the S’sessu systems (south of the Frontier), the spectral types were taken from the article “Phri’sk Anyone? Detailing the S’sessu Homeworlds” in issue 16 of the Frontier Explorer (p 23 – I haven’t gotten around to putting the individual articles of that issue on-line yet). However, that article only listed spectral types for two of the systems. For the other three, I selected random spectral types in the G & K spectral types from the list of random systems.

With all the star systems in place, I added in all the jump routes connecting those systems. I discovered I had a limit in my code that would not print a jump if it was over 14 light years in length. This was preventing the jump between Gruna Garu and Lynchpin from being drawn so I had to fix that bug. I still don’t let the random process create jumps that long but if you’re entering the data for a map and want a longer connection, the software won’t stop you anymore.

This also required me to change a couple of things. If you’re familiar with Zeb’s Guide, you may notice that the connection between Zebulon and Capella is now a straight line at 9 ly instead of a broken line at 10 ly. The broken line never made any sense given the Knight Hawks rules so I’ve done away with it. The other change was the connection between the S’sessu worlds of Kashra’sk and Minan. The map in the Frontier Explorer lists the distance as 12 ly but it is actually only 11. That is fixed on this map.

The next step is to now add in all the other systems on the map. To do this, I simply pull a system entry from the big random list for each star system on the map and remove the system from the big list so I don’t reuse it. I started in on that process, filling in the systems to the southwest of the Frontier but haven’t finished entering everything else yet. That will be the subject of the next update. However, here’s the big map as it currently stands.

Click for the full resolution version. This map is 4550×5050 px and ~1MB in size

This is just the raw, software generated map, with no tweaking or extra annotations on it. Over the next week or two, I’ll start adding in the rest of the stars and the nebulae. This map covers an area 90 ly wide and 100 ly high which should give your players plenty of area to explore if they need to get out of the Frontier and into the wilds.

That’s it for now

That’s where the project currently stands. If you have any thoughts, questions, or suggestions, let me know in the comments below.

June 18, 2019 Tom 1 Comment

Expanded Frontier Map – update 3

It’s been a fairly busy couple of weeks between family vacation and recovering from said vacation. I’ve been working on the map project but a lot of it has been behind the scenes and not anything that is easily displayable although some progress has been made. Additionally, I took the first steps toward getting the Murder at Rosegard adventure actually written up into a coherent document but again, nothing to display. So on to the map work.

Working on the Nebulae

This first bit definitely falls into the non-visible bit. I began implementing code that will allow me to draw the nebula. Over the past couple of weeks I figured out an good algorithm to use to trace the grid boxes containing the nebula and dived a bit into the code for SVG graphics to understand how to draw curvy lines.

There is nothing to see here yet but the next steps that I’ll be working on are:

  • Write the code that draws the curvy boundaries for a predefined nebula region
  • Write code to read in nebula regions from the data file
  • Write code to randomly generated nebula regions from some to-be-specified parameters.

That will probably be the content of the next update.

Stellar colors

The other major bit I worked on was adding in code to interpolate the colors of the stars based on their actual spectral type. Originally, the code could just handle a few spectral types: B0, A0, F0, G0, K0, & M0 plus a few special types like brown & white dwarfs, black holes, and neutron stars. That is what you’ve been seeing in the maps to date.

The colors for those stars were picked partially to be visually accurate and partially to aesthetically pleasing. Basically I had to exaggerate the color variations between the stars as almost all of them would appear white to the human eye. The interpolated colors will smoothly shift between these predefined colors.

What I wanted was to be able to handle any spectral type, i.e. G2, F3, K7, M5, etc. To do this I needed to interpolate the colors down the spectral sequences. It took a bit of reworking the code to do the interpolation and that’s were I spent most of the time I had this week.

Once that was done, I went back through and put in the actual spectral types for all of the named Frontier sector stars. These were derived from a variety of places. In the original rules, the stars were just given colors which correspond roughly to spectral types. Then there were a few more details in the published modules. Zebulon’s Guide to Frontier Space provided actual spectral type designations for all the stars in the Frontier. However, some of those spectral types in Zeb’s Guide didn’t agree with the previously published material.

This isn’t the first time I’ve tried to do this and luckily, the last time I did it, I recorded all the information. That was done on my Star Frontiers Network Wiki in the Frontier Travel Guide section. So for most of the stars, all I had to do was go through the pages on the wiki and grab the spectral types I had already figured out for each star.

With those code updates, and the updated spectral type values, you get the following map of the Frontier.

Frontier map with the stars of the named systems having the correct colors

There are a couple of things missing from this map. First, I didn’t put the nebula back on as this was a test of the spectral colors. Plus I didn’t do anything for Padda or the star systems labeled with the FSnn designations. Those are still at the “0” spectral types. I will get to those but there is another bit of the code I want to update first (more below).

Oh yea, @Fiddleback on Twitter mentioned he couldn’t see his house and I promised him a zoom box.

The Full Map

The other thing I worked on was getting everything set up for the big map of the full extended Frontier region. This mainly involved just translating the systems in this map to the larger canvas.

There’s no difference between this one and the one above, it is just situated on the canvas is the correct position to correspond to the big black and white map. Over the next little while I’ll be adding in all the other systems as I extract their coordinates from the big map into the data file that generates this map. Watch for updates in the future.

What’s Next?

I’ve already mentioned the work on the nebulae that I have on deck. On the spectral type front there are a few things I want to add there as far as functionality goes.

First, (this is the bit I hinted at above) I want to add code to the random system generation to properly generate the 0-9 subtypes. The relative ratios of major types (A, G, M, etc.) are accounted for but I need to get the relative numbers withing the major types correct. I have the data (or can get it) to do that, I just need to crunch the numbers and write the code. Once that’s done, I’ll add real spectral types to the systems labeled with the FSnn designation and really be ready to generate the full map.

With the spectral types the other things I need to do include:

  • Add code for drawing non-main sequence stars. Right now it handles all the main sequence stars (luminosity class V) and some giants and super-giants (luminosity classes III and I) but it may need to handle more when I get the full random generator done.
  • Add some interpolation of stellar sizes for main sequence K stars. Right now they are set to a fixed size but I’d like the later K stars to be a bit smaller than the G and early K stars and approach the size of the M stars. Again, the data is there in the program, I just need to code the interpolation.
  • Fix the color interpolation for M stars. It’s not obvious in the map that there is a problem since I don’t have any M stars that aren’t M0 but as you progress down the spectral sequence I’m interpolating to the colors of the Brown Dwarfs which are a pinkish color (In real life they’d be a really dull red which doesn’t stand out on the map). I want to make the interpolation go to a deeper red instead of pink. This should be a really quick fix. I know what needs to be done, I just need to code it up and test it.

Since I can do the nebula by hand for the Extended Frontier map, this work on the spectral types is where I’ll be focusing my efforts for the next little while. Once those updates are done, I’ll have everything I need to make the full-color Extended Frontier map.

The Code

Again, If you want to play with the code as I’m working on it, you can grab the current version from my StarMapGen repository on GitHub. This is still not the most user-friendly program to run as it it requires coding in all the parameters by hand before running but that’s on my todo list as well.

June 11, 2019 Tom Leave a comment

Expanded Frontier Map – update 2

Okay, this project has obviously grabbed my interest as I’ve spent way too much time on it recently. I’m actually writing this before last week’s post goes live and I had to force myself to write the campaign post rather than this one. If you haven’t read the first two parts of this series, they are here: part 1, part 2. So what’s new?

Names

First up is names. I had mentioned that I needed to do some tweaking on the black and white version of the map before I was ready to release it with all the stars labeled with their designations. I sat down and did that one day while my daughter was at soccer practice. That gives us the updated big map.

All of the systems (and a few just on the edge) of the original Frontier map (from the Alpha Dawn rules) received an “FS” designation for “Frontier Sector” The few beyond were either afterthoughts that I missed the first time around or ones give that designation in the Beyond the Frontier series of modules. There are 56 of those systems.

All the other systems on the map received an “OFS” designation for “Outer Frontier System”. There ended up being 227 systems with that designation for a total of 283 star systems on the map. The OFS designation dates from when I first made this map way back in the 80’s.

After reading the Beyond the Frontier series of modules, I had the idea for a campaign where the PCs ran an operated a series of exploration missions into the region that Zeb’s Guide declared to be the Rim. I created this map and designated the stars beyond the original Frontier with OFS numbers. The numbers on this map do not correspond to those original numbers (especially since I had to move some systems around to match the Zeb’s Guide map) but that’s where the concept came from.

This is the map of the Expanding Frontier. If I ever place adventures or locations in one of these systems, I’ll use these designations so you can find them.

In addition to adding designations to the larger map, I added the capability into my map generation program to print out the names of the star systems. Currently it randomly generates a name based on the systems coordinates in the random generation portion but reading in data from the file for the Frontier I was able to give the actual names of the systems, either their name or the FS designation. Running the program with that capability results in the following map.

I’m using the Copperplate Gothic Bold font for the text. I just really like the look of that font with its small caps and serifs. It’s the same font I used on the black and white version of the map.

Again, I’ve done nothing to tweak the positions of any of the labeling on this map. That will be a final step that will have to be done by hand. Another behind-the-scenes change I made to the code was to have the output created on different layers. Thus the black background is one layer, the grid is another, the stars a third, the jumps a fourth, and the names on a fifth. That way you can turn each layer on or off as desired when generating the final PNG or JPG file from the SVG file.

Star Scaling

You may also notice that the neutron star jets are larger compared to the one in the previous post. I figured out how to properly scale the symbol for the neutron star to match the others. There were some other internal tweaks to the way I did the scaling in the program that make it more robust and will allow me to do things in a more controlled manner in the future.

Nebulae

With the scaling and the names done, it was time to tackle the nebula.

In the interest of seeing if I could just do the final map if the program drew the stars, names, and jumps (since I have nebula shapes on the black and white map), I decided to sit down and play with Inkscape to see if I could come up with a way to get a nebula effect using the filters built into the program.

I had looked around on-line and there were some examples of how to do a full image, or do make a random nebula and cut it out to paste into your image, but nothing that would take an already determined shape and make something that looked like a nebula out of it. So I was on my own.

This is where I spent way too much time on the project in the past week but I was having too much fun to stop. In the end I did come up with a way to make nebulae that I think I can reproduce within the program itself. It will be specific to rendering the file in Inkscape, but since that’s a free, open-source program, I don’t feel bad about making that a requirement.

Here’s a sample nebula created by this process (which I’ll describe in a minute).

Once I figured out the filter combination to use, I was excited and tried it on the full color map using the nebula shapes from the black and white one. And it failed miserably.

It turns out that the patterns generated depend on the scale of the map and my maps generated by the program were using pixels as the scale while all the test nebula I had been doing were using millimeters, which were off by a factor of almost 4. So I was getting way too much variation across the shapes.

So I had a couple of choices. I could either take the shapes, put them in a document with the correct (mm) scale, generate the nebula patterns, and copy them back into the final document. Or I could figure out a way to make it work in the computer generated document.

I spend a lot of time playing with the filters and making changes to the filter settings trying to come up with something that would work in the programmatically generated maps but in the end I couldn’t find anything that was easy to apply that I really liked. (Or even something that was hard to apply that I liked). In the end I changed my program to output the files, still using pixels, but using millimeters as the scale parameter and things work out just fine.

Using the shapes from the black and white map, and playing with different color schemes to test them out, gave me the following map.

This is first attempt, the final map will have different colors and shapes in the end but I wanted to see what it potentially would look like and play with the color combinations to see what I liked.

The nebulae really bog down the rendering when they are all done so I’ll probably put each of them on their own layer that I can turn on and off as needed to speed things up.

How to make a nebula

So how exactly did I make these? Once I figured it out, it’s actually fairly quick. First, draw a rough shape of the nebula.

Next, apply two Texture filters. The first is the “Crumpled Plastic filter” (Filters->Textures->Crumpled Plastic). Which gives us something like this:

This isn’t the most intuitive filter to apply but bear with me. The various ridges and color variations provide the structure of the nebula when we get to the next step. Next apply the “Watercolor” texture (Filters->Textures->Watercolor). And now we have a nebula.

You’ll notice that it shifts the shape somewhat. That’s fine by me because I’m going for the effect more than the exact shape. If the shape is more important, there’s another filter you can use which I’ll talk about below. It also expands the nebula a bit and can make it go outside the original area.

Next we need to add the color tones. This takes several steps. First duplicate the nebula and change the color of the second one. In this case, I’m changing it to purple (#ff00ff).

Next shrink the “interior nebula” with the new color. I did this using the Path->Inset command ( ctrl-‘(‘ ), applying it 2-5 times. Then select the “outer nebula”, i.e. the original one, and make it a little larger using the Path->Outset command ( ctrl-‘)’ ), again applying 2-5 times. If that makes everything too big, you can leave the outer nebula size alone and just shrink the inner one. You might also play with the opacity of the “inner” nebula and maybe change the fill from solid to a radial gradient. Just play with it to get something you like.

In this particular case, I expand the outer nebula 4 times, shrunk the inner nebula 5 and gave the inner nebula a radial gradient on it’s fill instead of it being solid.

Add in the black background and your done.

One thing I discovered is that if you move the shape around on the image, it changes the shape of the nebula. If you want to move it around without changing the shape, you have to first copy it and then re-paste it back into the image. That locks it’s parameters and you can no longer change it.

Also, another filter that you can use for a slightly different effect, either in place of the crumpled plastic filter or the watercolor one, is the Inkblot filter (Filter->Textures->Inkblot…). This one has some knobs you can tweak so you’ll have to play with it a bit more. If you want to keep the shape of the final nebula closer to the original shape drawn, you might want to use this filter instead of Watercolor with low horizontal and vertical inlay parameters. I just like the combination above a little bit better.

The great thing about these filters is that you can store them directly into the SVG file. So I should be able to make the nebula directly in the files although they will now only work with Inkscape instead of any generic SVG rendering program. To me that’s a small price to pay.

Up Next

The next step on this journey is to get program to read and write the nebula shapes from a file. Eventually, I’ll also want it to randomly generate nebula on the map in places where there aren’t any stars or jump routes. I have ideas on how best to do that, I just need to play around with the code to make it happen.

How do you like the nebula on the color map? Which color combinations do you like best? Are there others that you think I should try? Let me know in the comments below.

May 28, 2019 Tom Leave a comment

Expanded Frontier Map – update 1

I had planned to to have the next part of the module campaign write-up as the post this week, but that’s taking me a bit longer than I had planned and I spent more time than I should have on updates to the Expanded Frontier Map so I’m writing about that instead.

As I said in my last State of the Frontier post, one of the things I want to work on this year is a full color version of the Expanded Frontier map. So while I was on vacation, I fired up my laptop and started on that. This post will detail some of the things I’m working on and what to look for in the future.

Corrections

The first thing I had to do was fix some errors I noticed in my original expanded map. Mainly, I had left off some labels on a few of the star systems. I haven’t posted a version of the map with those labels yet but will in the future. So I added those in.

The other omission I had to correct was one I noticed in creating entries for the Detailed Frontier Timeline. I was missing a necessary jump route for the sathar. So I added that in as well. Again, I haven’t posted that version of the map so the correction just appears on my “Referee’s Copy” at the moment.

Next, I decided to shift the system I was labeling as Belnafaer (from the SFAD5: Bugs in the the System module) to the same one that the TSR folks did in the Frontier map in Zeb’s Guide. The choice was arbitrary and both my selection and theirs matched the description given in the module. I figured it was better to disagree as little as possible with the “canon” material. (I’m still not moving Starmist or Rhianna though).

Finally, I discovered that the labeled distance from Madderly’s Star to White Light was wrong. The map labels it as 6 but it is actually 8. (The map in Zeb’s Guide has it correct but the one in the Dramune Run is wrong as well.) This was actually discovered in making the color map as described below. So I fixed that. It’s funny, but I’ve been playing Star Frontiers for 35 years now and never noticed that typo.

Those were the corrections I made. While you can’t see two of them, this is the resulting map:

The inner blue box is the original Frontier map area from Alpha Dawn while the larger blue box is the area covered by the map in Zebulon’s Guide to Frontier Space

I also fixed up some internal errors, mostly labels on the wrong layers, but that has no impact on the map itself. I had planned to post the version with all the star designations, but in looking at them, I realized they need some cleaning up on their positioning so it wasn’t quite ready to go for this post. I need to spend about an hour tweaking things.

Moving on to Color

Star symbols from the map generation program

As I mentioned before, I had written a program to randomly generate sector maps. The stars were represented using the symbols in the chart to the right. The second column showing how multiple star systems are represented.

As written, the program only generated random systems and wrote basic map data out to a file. What I needed was the ability to read in that output file and build the map from the data instead of randomly.

So that’s where I started. I had an output format, I just needed code to read that and convert it back into data that could be used for drawing the map. Along the way, I realized that I needed to change some things about the way the data was represented and stored in the program and output file as we well as needing to add storage for things like the name of the system.

Another thing I had to change was the printing of the Z-coordinate. The random map generation process creates star systems in 3 dimensions and labels each system with its Z-coordinate above or below the plane of the map. Since for the Frontier Map (at least initially) everything is on the same plane, there was no need to print little zeros by each star system. So I added a flag to turn off printing that coordinate on the map.

Generating the Data for the Frontier Map

With the code now ready to read data from a file and draw the map. I needed to generate the data for the Frontier map. As I’m building and testing the software, I figured I’d work with a smaller map so I’m just using the original Frontier Map from the Alpha Dawn rules.

There are 51 systems on that map. I determined the coordinates on the map (as the software sees them, currently measured from the upper right corner – that may change), and wrote those into a data file. That was the easy part.

The next step was to get spectral classifications for each of the systems. The inhabited systems were relatively easy. In the listing for each of the systems in the rule book, it gives a color for the star. At this point the program isn’t refined enough to break down the spectral types so a G0 star is represented the same as a G2 or G8 star. So I only had to approximate. Yellow stars got a G0 designation, orange stars got a K0 designation, white stars got an F0 designation, and red stars got a M0 designation. I used those since those are the spectral types that the program currently understands.

Next I went through and added in the spectral types for the stars that host the various planets of the modules and added in designations for them. Then, I had to go in and add in the designations for star systems in the Rim that were labeled in Zebulon’s Guide. Zeb’s Guide give full spectral types (F7, G3, K2, etc.) but for now, I just used the spectral type letter and not the number since the program can’t process those yet. (Note: if you compare the spectral types from Zeb’s Guide for the original Frontier worlds to the colors given in the Alpha Dawn rules, they don’t always agree. That’s something I’ll have to resolve later. For now, AD takes precedence.)

That covers all the “explored” systems. Note that I didn’t use the Zeb’s Guide data for the megacorp systems. I can always go back and add that but I don’t use those systems in my game. Finally for all the other systems, I had to randomly generate spectral types. To do that, I just generated a map with random values and copied the appropriate values over for the binary and single systems, only selecting single systems that were M stars or brown dwarfs. There are already way too many F, G, & K type stars in the region so I wanted a sprinkling of the other types. I also added the neutron star designation by hand for that system on the map.

Then it was time to actually run the program and make the map. It worked fine but looking at it I noticed a few problems with the jump distances. Several were too small by one and one was too large. Looking closer, I realized that while I was calculating the distances correctly, it was rounding wrong on display so I fixed that which corrected the distances displaying too small. That just left me with the one jump distance that was too large, now by two instead of one. This is where I discovered the typo on the original map for the distance between White Light and Madderly’s Star. The program was giving the correct distance but the original map was wrong.

I also decided that the symbols were a bit too small. The size I was using worked fine in the random map when there was the possibility of two systems in the same grid box with different Z-coordinates but for this map, where that couldn’t happen, I wanted the symbols larger. So I built in a scaling parameter in to the program allowing me to control the scale.

With those changes, we have the following initial color map of the Frontier.

The grid is there, you just can’t see it at this size. Click for the full size image.

You’ll notice a few things right away. First, there are no names on the map. Second, there are no nebulae. Right now the program doesn’t do those things.

Names will be relatively easy. I have the data, I just need to have the program add them to the image file. I need to research how to set fonts but otherwise, it’s straightforward.

Nebula are a whole different story. And may have to be added in by hand after the fact. Either way, that is going to be a complicated process and require some learning and work (and artistic ability) on my part.

If you look closer, you’ll notice that the positioning of the numbers along the jump routes are not optimal. It works for most of the jumps but for connections that are at an approximately 45 degree angle running from upper left to lower right, the number comes out too close (and sometimes overlapping) the line. I’ll need to fix that. That cleanup will probably be done by hand.

The program generates SVG files where each item is an object that can be manipulated allowing me to tweak things by hand. That was done intentionally as I knew the program wouldn’t be able to get everything perfect. That will be even more apparent once the names are added. I suspect that many of them will have to be moved to not overlap the jump routes.

The other minor thing is that the scaling factor I added wasn’t able to affect the size of the jets coming out of the neutron star. I need to either figure that out or, more likely, reduce the size back down for that spectral type and ignore the scaling. We’ll see how that goes.

Next Steps

The easy next steps are adding in the names of the systems and fixing the scaling on the neutron star.

After that, what I want to do is add in a way to handle all the various spectral types. The colors I picked don’t exactly represent the colors of the stars. They are close, but were chose for aesthetics rather than complete accuracy. Almost everything would be white with just some color tinting if we went for accuracy. I did that originally but didn’t like the result. I want to add code that will extrapolate between the given colors for the various spectral types’ number values to give various shades to the stars.

After that, I plan on tackling the nebula. I want to see if I can programmatically come up with something passable to start and then refine it.

The Code

If you want to play with the code, you can find it on my GitHub repository. It’s written in Python and right now isn’t the most user friendly. I need to add some in-line documentation as well as add features that will make it more usable directly from a command line instead of having to modify parameters in the code itself before running. That is another future project. But if you want to dive in and play with it as is, feel free.

May 14, 2019 Tom Leave a comment

Pursale Colony Ship Sketches

It’s taken me a long time to get to this point but I finally have sketches of the ship embedded in the center of the Outpost Osiris asteroid. These are my initial roughs that I will fill in with details as I complete the write-ups.

The scale on the images is 5 meters to the square. This ship is quite large with a “wingspan” of nearly 200m and a length of over 300m. It consists of five decks each of various sizes. I’m going to try to do a 3D render of the shape of the ship at some point.

The bold outer outline in each of the following images represents the outer hull of the middle deck (deck 3). It is shown on each of the images to allow you to compare the other decks to the overall size of the ship.

Only parts of the ship are going to be physically accessible in the module. Other parts are fused with the rock of the asteroid or crystalline structures piercing through the body of the ship in the central cavity of the asteroid. I’ll be deciding exactly what is obstructed and what isn’t as I work on the module details. I know for sure that the engines are not accessible and that the phase shield room (deck 3) and power core (deck 4) are undamaged as is the starboard airlock. Some of the robot storage areas will be accessible as will at least one cryo bay (so the characters can find some desiccated Pursale remains) but beyond that, I haven’t decided what to make accessible. That will come at a future date.

So here are the five decks of the ship, from bottom to top.

Deck 1 – Shuttle bays

This deck primarily contains 8 shuttle bays, a storage area, and the ship’s two underbelly laser batteries. The large engines out on the wings also extend down to this part of the ship but are not accessible from here. The large storage area here contained colonization supplies.

Deck 2 – Robots and Tech

This deck has another large storage area for colonization supplies, as well as the robot storage areas and a tech shop. There are also two more shuttle bays on this level as well as the first of many cryo bays containing rows and rows of the (once) frozen colonists.

Deck 3 – Crew Deck

This is the largest deck of the ship. It contains the engineering section, access to the engines and the crew quarters for the active crew. There is a large garden area, dining an food storage, as well as several cryo chambers. There is also an aft observation deck, forward sensors, and the ships two forward facing laser batteries. The airlocks are also on this level as are some of the ship’s workpods. The phase shield generator is located on this deck in the very center of the ship.

Deck 4 – Cryo Bays and Power

This deck consists almost completely of cryo storage bays containing colonists in frozen storage. The only other ship system on this level is the ship’s power core, which amazingly wasn’t destroyed when the ship unphased into the asteroid.

Deck 5 – Bridge

This deck contains the ship’s bridge and medical facilities, a few more smaller cryo bays, as well as the ship’s launches and some more workpods. It also has the upper laser battery.

Next Steps

This is the ship as built when fleeing the Pursale homeworld and fully functional. By the time the PCs discover it, it has been embedded in the asteroid of millenia. Many of the parts of the ship are fused with either the rocks of the asteroid or crystalline structures in the central cavity. All of the crew and colonists are long dead however some of the robots, along with some parts of the ship’s machinery has survived.

The next step is to figure out which parts of the ship are still accessible and create the actual maps for the game along with the description of the various areas.

The intention of this part of the adventure is for the players to make their way onto the ship, overcoming the last of the ship’s defenses, and attempt to obtain the phase shield generator off the ship and install it on their own. They then need to feel the outpost as their tampering has caused the ship’s power core to enter a self-destruct mode that cannot be stopped.

The details of the ship are still fairly malleable so let me know if there are any major ship systems or details that you think I missed.

April 16, 2019 Tom 1 Comment

Maps from the Past

This post is going up a day late. Partially because I didn’t finish what I had wanted to post yesterday in time, and partially because time got away from me working on issue 24 of the Frontier Explorer (which is almost done). So I didn’t have a post ready yesterday

My original plan was to post my sketches of the Pursale ship entombed in the center of the Outpost Osiris asteroid. But in looking at those I realized a couple of things:

  1. I had used the wrong scale grid when building the original sketches. Interestingly enough when I applied the correct grid to the maps, all the corridors I had free-handed in that were off the original, wrong grid, matched up almost perfectly with the correct grid. I guess subconsciously I knew there was something wrong.
  2. I forgot a few fairly important parts of the ship, for example airlocks.

That means I need to rework the sketches before they are ready to present. That’s this week’s project.

In the mean time, I rooted around in my old folders and found some old location maps that I drew way back in the late 80’s as a teenager when I was actively playing Star Frontiers in high school. I’d probably draw them differently now, but they definitely hold a bit of nostalgia.

I’m presenting them in this post as-is. These are simply scans of the original hand-drawn maps that were created on 8.5×11 quad-ruled graph paper. (I even think I still have some of the original pads as I bought a big box of them back in the day.) I’ll be providing a little bit of commentary but not much. I actually have write-ups for some of them but I’ll hold that for a later post when I have a chance to review them and update them to remove any glaring errors I made as a teenager when I first concocted them. For all of the images, you can click on them to get the full 200dpi resolution version (each one is about 5 MB in size).

Conference Center

This one is a portion of a large area map. It is inside a clear, domed area which I think was supposed to be on an asteroid or moon but given the layout, needs some significant gravity. This location is the basis of a murder mystery adventure. I’ll definitely be updating and writing this one up at some point in the future.

Pirate Base

This location consists of three maps, and as far as I can tell, I don’t have any sort of write-up for this one. Although it is supposed to be in an asteroid. Probably inspired by the idea of the Planaron pirate base from Warrior of White Light. Do with it as you will.

Upper Level

This is the main level with the main entrance via the airlock in the lower left. I think this one has some serious scale issues. According to the scale at the bottom, one square is 10 meters. Which makes those passages large enough to drive trucks down. It probably should be 2m per square.

Lower Level

This is the officer level with private facilities, also two different escape routes, one via the airlock in the upper left to a tunnel through the asteroid and the secret exit in the upper right

Secret Escape Bay

The pirate officers have an assault scout stashed away in a hidden bunker. That ship is 21.5 squares long which gives more credence to the 1 square is 2m scale hypothesis. I vaguely remember painstakingly drawing that assault scout based on the image on the little Knight Hawks chit.

Sathar Training Base

Our last location is a set of two maps detailing a sathar training base. I’m pretty sure this one was inspired by the sathar training base in the Sundown on Starmist module. I have a write-up for this one as well that I will post in the future once I’ve had a chance to review it.

Surface Level

This is nestled in a forested area and has a number of features that stick up through the trees. I was also inspired to draw a profile view (lower right) that is looking from the bottom of the map towards the top.

Lower Level

This is the actual base and built completely underground. The defense turret is automated and has a magazine that feeds the rocket launcher and recoilless rifles mounted on the defense dome.

Other Locations

I have several other maps of other locations I developed back in the day, and even more recently. There are only one or two of the older ones that I would consider useful. Most of them were way too far fetched and fantastical for any game I’d run today but I guess made sense to my teen-aged self.

I hope you enjoyed this little walk down memory lane with me. Let me know what you think of these maps and which if any you’d like to see detailed out first. Feel free to use these maps in your own games if you want.

In the mean time, I need to get back to working on the alien ship for the Ghost Ship Osiris module. See you next week.

April 10, 2019 Tom Leave a comment

Posts navigation

← Previous 1 2 3 4 Next →
Become a Patron!

Recent Posts

  • Detailed Frontier Timeline – FY62.069 to FY62.99
  • State of the Frontier – August 2022
  • Battle of Hargut (Gruna Garu) – FY62.098
  • Archived Arcane Game Lore Posts – May 2013 to Dec 2014
  • A Look at Yachts and Privateers
  • Homeworld Bound – A Campaign Concept
  • Second Battle of Fromeltar (Terledrom) – FY62.083
  • Sample Star System Data
  • Detailed Frontier Timeline – FY62.038 to FY62.068
  • State of the Frontier – July 2022

Categories

  • 3D Models
  • Adventures
  • Background
  • Creatures/Races
  • Deck Plans
  • Equipment
  • Game Design
  • General
  • Locations
  • Maps
  • NPCs
  • Optional Rules
  • Patreon-only
  • Project Overviews
  • Reviews
  • Setting Material
  • Starships
  • System Brief
  • Vehicles
  • Writing

Recent Comments

  • Loguar on Detailed Frontier Timeline – FY62.069 to FY62.99
  • Loguar on Detailed Frontier Timeline – FY62.069 to FY62.99
  • Tom on Detailed Frontier Timeline – FY62.069 to FY62.99
  • Rook on Maps and Counters
  • Loguar on Detailed Frontier Timeline – FY62.069 to FY62.99
  • Tom on Detailed Frontier Timeline – FY62.069 to FY62.99
  • Tom on Second Battle of Fromeltar (Terledrom) – FY62.083
  • Loguar on Detailed Frontier Timeline – FY62.069 to FY62.99
  • Loguar on Second Battle of Fromeltar (Terledrom) – FY62.083
  • Aemon Aylward on Sample Star System Data

Archives

  • September 2022 (1)
  • August 2022 (9)
  • July 2022 (3)
  • June 2022 (3)
  • May 2022 (3)
  • June 2021 (1)
  • April 2021 (1)
  • February 2021 (4)
  • January 2021 (6)
  • December 2020 (5)
  • November 2020 (11)
  • October 2020 (4)
  • September 2020 (5)
  • August 2020 (4)
  • July 2020 (6)
  • June 2020 (5)
  • May 2020 (8)
  • April 2020 (5)
  • March 2020 (5)
  • February 2020 (5)
  • January 2020 (5)
  • December 2019 (7)
  • November 2019 (4)
  • October 2019 (6)
  • September 2019 (5)
  • August 2019 (6)
  • July 2019 (7)
  • June 2019 (5)
  • May 2019 (6)
  • April 2019 (7)
  • March 2019 (4)
  • February 2019 (5)
  • January 2019 (7)
  • December 2018 (5)
  • November 2018 (10)
  • October 2018 (4)
  • September 2018 (4)
  • August 2018 (5)
  • July 2018 (4)
  • June 2018 (4)
  • May 2018 (12)
  • December 2015 (1)
  • November 2015 (2)
  • December 2014 (4)
  • November 2014 (3)
  • June 2014 (1)
  • January 2014 (1)
  • July 2013 (1)
  • June 2013 (2)
  • May 2013 (3)

Meta

  • Log in
  • Entries feed
  • Comments feed
  • WordPress.org
Powered by WordPress | theme Layout Builder